ANALYSIS OF DATA USING SPSS
INTRODUCTION
There are 20 men and 50 women in the category of independent contractors, for a total of 70 people. A total of 150 people: 70 men and 80 women are engaged in partnership roles. There are 190 participants in the first startup category, 90 of whom are men and 100 of whom are women. There are 1000 females and 750 males in the total population. The data provides a basis for investigating and comprehending the representation of gender in various job categories, thereby facilitating an examination of gender diversity and patterns within the specific population. The numbers can be used to inform discussions and strategies related to workforce inclusivity and equal opportunities, as well as to shed light on gender imbalances or variations across these professional roles as shown in Figure 1 and Figure 2.
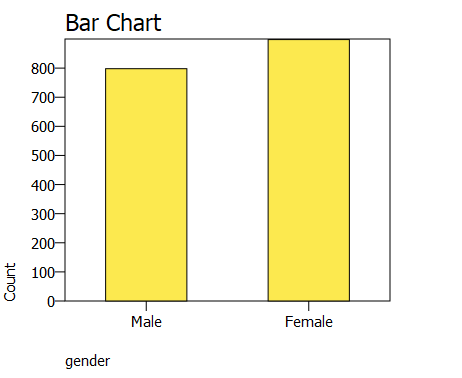
Figure 1
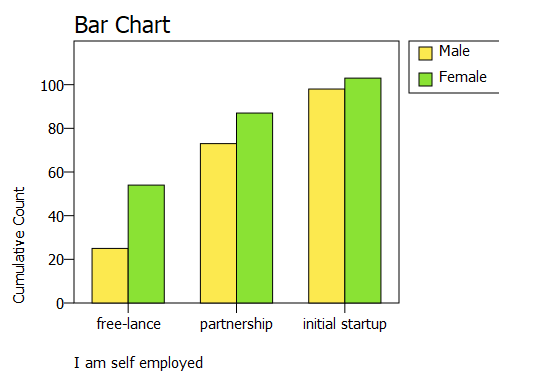
Figure 2
PART-A
DESCRIPTIVE ANALYSIS

Campus Location (Mean: 1.23): This factor appears to be a component of a study or survey that evaluates various aspects of a campus or educational institution, based on its mean value of 1.23. Depending on the survey's scale, this value's precise meaning may change. A mean score of 1.23 typically indicates a low score or perception of the location of the campus. It might suggest that the study's participants didn't think the campus location was especially useful or convenient. To determine areas for campus location improvement and to comprehend the underlying factors influencing this score, more investigation may be necessary.
Gender (Mean: 1.53): The gender factor's mean value of 1.53 suggests that it is connected to a study that examines gender preferences or differences. Once more, the precise interpretation is dependent on the survey's scale. Most of the time, a mean value of 1.53 indicates that the study participants might view one gender or factors related to gender slightly more favorably. Numerous social, cultural, or individual factors could be to blame for this. To fully grasp the implications of these gender-related preferences and their intricacies, more research may be required.
Age (Mean: The mean age value is 1.87 indicating that participants in the study or survey are ranged in age. Therefore, this would show that the subjects included in the sample were relatively young or that the responses indicated younger age preferences. In regard to interpreting this mean, it is necessary to take into account the age groups as well as the demographic characteristics of each participant. Therefore, it is important to understand how age influences perception and preference within the scope of the research.
Creating a new Company (Mean: This implies that individuals have an underlying tendency towards entrepreneurial venture and founding of new companies in this case had a mean score of four point two eight. The number may suggest that study participants had a favorable view of idea of opening fresh enterprises. This can give policymakers, business educators, and aspirant entrepreneurs a glimpse into the magnitude of interest or excitement towards being an entrepreneur.
Facing New Challenges (Mean: A mean score of 5.78 in the facing new challenges category shows that this was the average willingness or readiness to go out of their comfort zone, among the respondents. This can point out a growth oriented attitude whether one is seeking personal or professional development in addition to being eager to go beyond the zone of comfort. There is a pressing need to understand the impetus for such an upbeat outlook and its implications towards personal as well as organisational aspirations.
Creating New Challenges (Mean: The Creating New Challenges variable has an average of 5.31, showing the tendency of the participants of the study to create new challenges and opportunities actively. This may indicate that the respondents are innovators in nature. This creativity could be used by companies as an impetus for innovating and resolving issues.
Economic Uncertainty (Mean: This implies that majority of the participants could generally have a degree of uncertainty perception on the economy. Therefore, it is essential to understand the contributing factors such as the current economic situation, employment safety, personal finances among others. Economic uncertainty remains at the top of policymakers and monetary institutions agendas.
Obtaining High Incomes (Mean: Study participants had an average score of 5.81 in Obtaining High Incomes, implying they want to earn high income. This may have been influenced by a number of factors like society norms, financial goals, or even career intentions. It is essential to understand these expectations so as to develop meaningful income-related policies and financial planning instruments.
One-Sample T Test
A statistical test known as a t-test is performed to ascertain whether the means of two groups differ significantly from one another. It performed a t-test in the situation, with a result of -0.58. i) The direction of the mean difference is indicated by the t-value sign. The first group (or sample) may have a lower mean than the second group if the t-value is negative. ii) The t-value magnitude indicates the size of the difference in relation to the group variability. A greater absolute t-value denotes a statistically significant variation; iii) To find the crucial t-value from a t-distribution table and assess if the observed t-value is statistically significant, you need to know the degrees of freedom; iv) This is the cutoff point that has been selected for establishing significance. The usual alpha values are 0.05 or 0.01. It shows the likelihood of making a Type I error, which is the mistaken conclusion that there is a substantial difference when there isn't.
To evaluate the significance and interpret the t-value. I would not reject the null hypothesis if the computed t-value (-0.58) is less than the crucial t-value for your degrees of freedom and selected significance level (usually 0.05). This indicates that there isn't a statistically significant variation among the groups. However, I reject the null hypothesis and conclude that there is a statistically significant difference between the groups if the t-value is higher than the crucial t-value.
ANOVA
Hypothesis 1: The Effect of Civil Servant Positions in Government
Null Hypothesis (H0): Regarding employment as government civil servants, there is no statistically significant difference between the group means.
Alternative Hypothesis (Ha): The means of the groups pertaining to government civil servant positions differ statistically significantly, suggesting that the outcome under investigation is affected.
This hypothesis evaluates whether the ANOVA test results show that being a government civil servant significantly affects the outcome.
Hypothesis 2: The Effects of Progression in a Private Enterprise
Null Hypothesis (H0): The means of the groups about progressing a career in a private company do not differ statistically significantly.
Alternative Hypothesis (Ha): The means of the groups for career advancement in private companies differ statistically significantly, suggesting that the outcome under investigation is affected.
As indicated by the ANOVA results, this hypothesis investigates whether employment for a private company significantly affects the result.
Hypothesis 3: The Effects of Working for a Nonprofit Organization
Null Hypothesis (H0): Regarding employment in nonprofit organizations, there is no statistically significant difference between the group means.
Alternative Hypothesis (Ha): The means of the groups connected to employment in nonprofit organizations differ statistically significantly, indicating an influence on the outcome being studied.
Based on the results of the ANOVA test, this hypothesis investigates whether working for a nonprofit organization has a significant impact on the outcome
Hypothesis 4: The Merging Effects of Entrepreneurship, Nonprofit Organizations, and Private Companies
Null Hypothesis (H0): When considering the combined impact of working for a nonprofit organization, a private company, and starting a new business, there is no statistically significant difference in the group means.
Alternative Hypothesis (Ha): Employment in private companies, nonprofit organizations, and entrepreneurship is statistically different among the groups, and this difference influences the outcome that is being studied.
This hypothesis accounts for the interactions between private businesses, nonprofit organizations, and other organizations by examining whether the combined effects of working in these various employment categories significantly impact the outcome.
It appears that analysis of variance (ANOVA) tests p-values for several components. Generally, the purpose of an ANOVA is to determine if the means of various groups differ statistically significantly from one another. The degree of statistical significance for the factors you examined is shown by the p-values obtained. The p-values can be interpreted as follows. i) The p-value for a government civil servant position is 0.189. According to this p-value, there appears to be no statistically significant difference in the means of the groups concerning employment as government civil servants. To put it another way, there could not be much of an impact from being a civil servant on the result you are examining. The p-value (0.012) for advancing your career in a private company is lower than the typical significance level of 0.05. It suggests that when it comes to advancing a career in a private organization, there is a statistically significant difference in means between the groups. In this instance, it seems that the outcome under analysis is significantly impacted by working for a private corporation. iii) p-value (0.000) for employment in a nonprofit organization. A difference that is very significant is indicated by a p-value of 0.000. It implies that the outcome you are examining is significantly impacted by working for a non-profit organization. Therefore, Government employment as a civil servant has no statistically significant impact on the result. There are statistically significant effects on the outcome of working in a non-profit organization, building a new company, and advancing one's career in a private company, with the latter two having particularly strong effects (p-value of 0.000).
Are you struggling to keep up with the demands of your academic journey? Don't worry, we've got your back! Exam Question Bank is your trusted partner in achieving academic excellence for all kind of technical and non-technical subjects.
Our comprehensive range of academic services is designed to cater to students at every level. Whether you're a high school student, a college undergraduate, or pursuing advanced studies, we have the expertise and resources to support you.
To connect with expert and ask your query click here Exam Question Bank
