BNS-3513 Data Analysis & Graphing in Excel Assignment
- Subject Code :
BNS-3513
- University :
UNIVERSITY OF FUJAIRAH COLLEGE OF INFORMATION TECHNOLOGY Exam Question Bank is not sponsored or endorsed by this college or university.
- Country :
United Arab Emirates
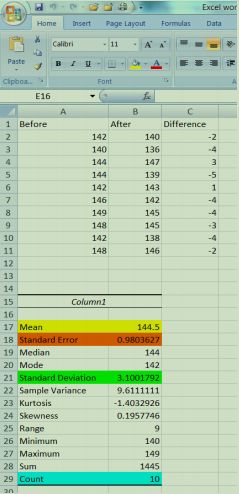
1. Enter Data in Excel
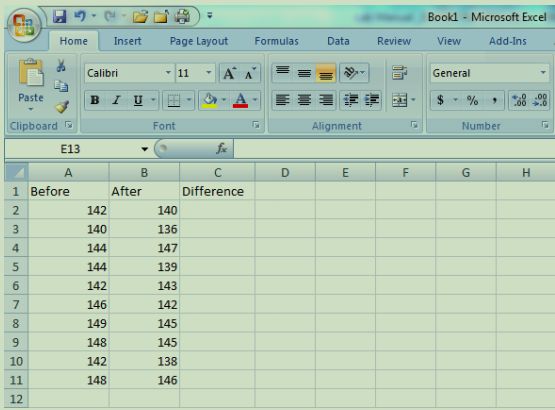
- In the Difference column, enter a function (aka an equation or formula) to tell Excel to subtract the before values from the after values.
- Always start a formula with a = symbol, then select the cell from column B,then type a - symbol, then select the cell from column A, then hit enter.
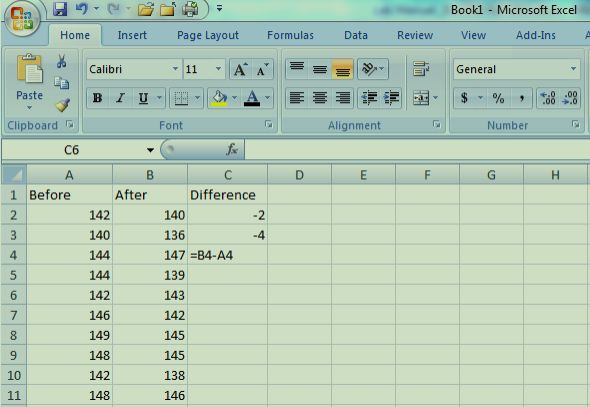
- The result will be displayed when you hit the enter key (see -2 and -4 shown in cells C2 and C3 below). The formula is shown in cell C4.
- Once you type in the formula, you can copy and paste that formula into the remaining cells of column C.
- If you want to calculate a paired t-test by hand, you will need these difference values. Otherwise, you will not use them to make your graphs or analyses.
2. Calculate Summary Statistics in Excel: Two Methods
- Use the data analysis tools.
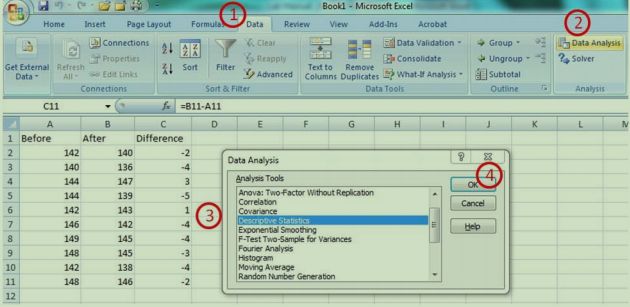
- Open the worksheet with your data. Select the Data tab , then Data Analysis , then from the list choose Descriptive Statistics and selectOK
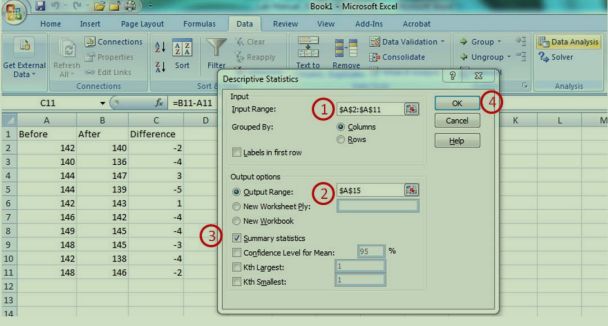
- From here, with your cursor in the Input Range , select your data in column A. Then put your cursor in the Output Range block and select an empty cell in your work sheet. Click the box labeled Summary Statistics so a check mark appears, then select OK .
- Excel will now show you the summary statistics. I have added highlights to show the mean, standard deviation, standard error, and sample size which are the summary statistics that you will most commonly use for your write-upsin our labs.
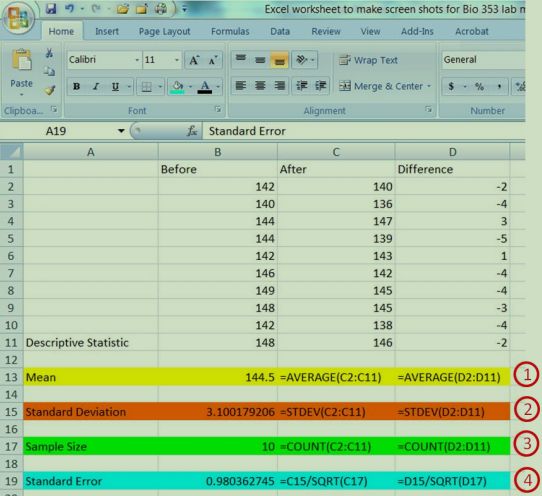
3.Calculate Summary Statistics in Excel by typing in the formula
Type in the formulas. For any formula, you can then copy/paste into cells for adjacent columns (be sure to check that excel is using the correct cells to calculatethe values)
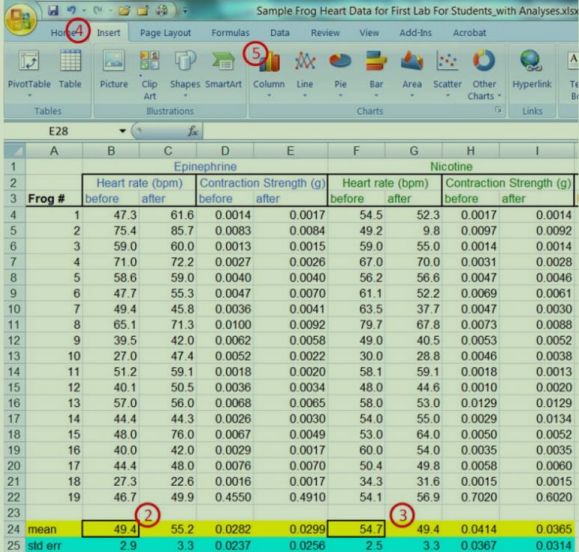
- Mean: the formula to tell Excel to calculate a mean is =average(select cellshere) . Type this formula into the appropriate cell and then hit enter.
- Standard Deviation: the formula to tell Excel to calculate a standard deviationis =stdev(select cells here) . Type this formula into the appropriate cell andthen hit enter.
- Sample size: the formula tell Excel to calculate your sample size is =count(select cells here) . Type this formula into the appropriate cell and then hit enter.
- Standard Error: The standard error is the standard deviation divided by the square root of the sample size. Therefore, the formula to tell Excel to calculate a standard error is =[select the cell for standard deviation]/sqrt([cellfor sample size]) . Type this formula into the appropriate cell and then hit enter.
2. Generate Comparative Statistics in Excel
- Use the data analysis tools.
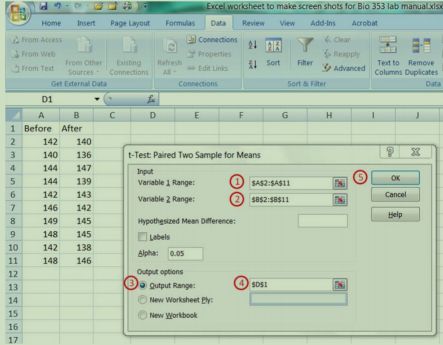
- Next, you need to tell Excel which data to compare. To do this, click in the empty Variable 1 Range box and then click>hold>drag your Before data . Repeat this process with your After data for the Variable 2 Range . Thenclick the Output Range option , and then select an empty cell where excel will begin to put your statistical output (NOTE: select a cell where the output will not overwrite existing data in your spreadsheet). Click OK
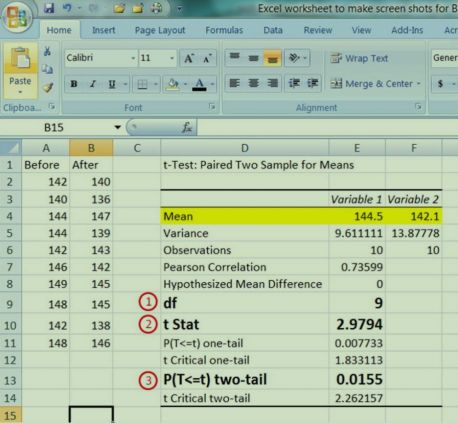
- Notice that the output from Excel includes a lot of information (note that the mean is shown again here). For our purposes, you only need to include threepieces of information when you report your paired t-test results.
- You should include your degrees of freedom (for a paired T-test, this isthe sample size minus one) .
- You should include your t statistic .
- You should include your two-tailed P-value . NOTE: If a P-value is less than 0.05, then you know that your two groups that you comparedare significantly different from each other. If the P-value is greater thanor equal to 0.05, then the two groups are not different from each other.
iv. Example of a sentence to be written in your results section:
Average heart rate decreased after frog hearts were exposed to pilocarpine (t = 2.98, df = 9, P = 0.016; Figure 1), where Figure onewould show your descriptive statistics (mean and error bars that aresome measure of dispersion).
d. Hint: there is some information that you should NOT include in yourpapers:
- NO RAW DATA should be in your paper as either a table or graph.
- DO NOT copy and paste the output shown above from Excel into yourlab write-up.
3. How to Create Graphs in Excel
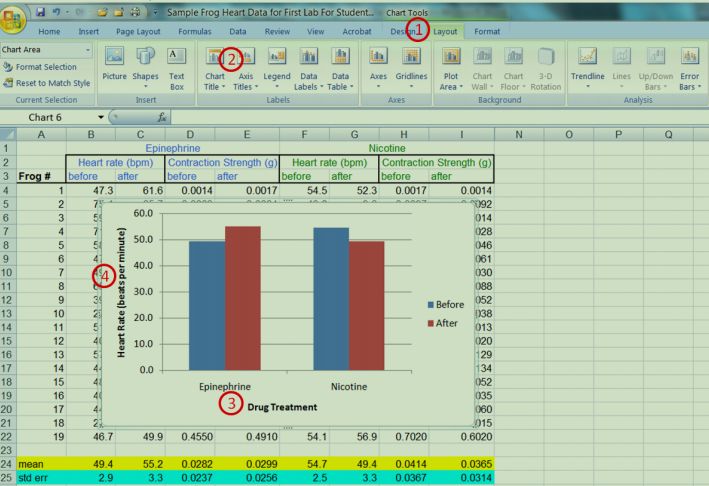
- Add the error bars. Do not use any of the default settings for error bars in Excelas they are incorrect. You must calculate either standard error or standard deviationand use these values to plot error bars on your graph. For this example, you will plot 1 standard error for each error bar.
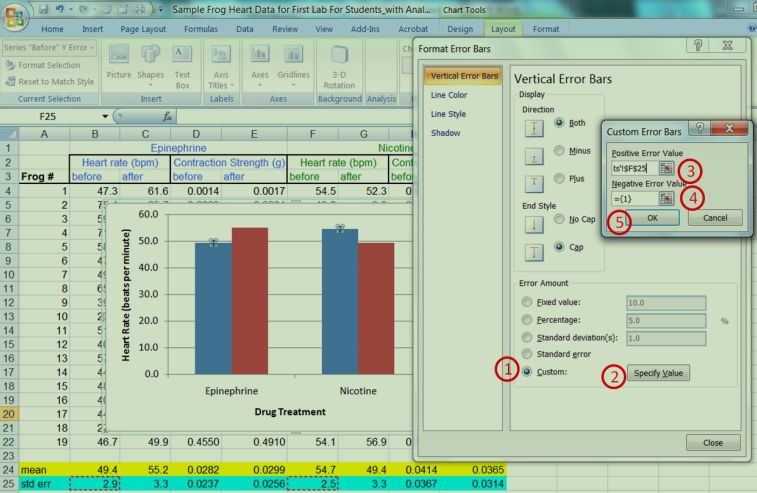
- Click on the graph to bring up the Chart Tools tab. Select Layout>Error Bars>More Error Bars options (the last choice on the drop down menu). Toplace error bars for the before values, click on Before and then OK.
- From this menu, choose Custom and Specify Value . For the Positive Error Value , delete the nonsense characters. Hold the CTRL key and then select the Before standard error value of heart rate for Epinephrineand then for Nicotine. Repeat this process for the Negative Error Value . Select OK , then Close. Now the error bars are plotted for the Before values. Repeat this process for the After values.
Are you struggling to keep up with the demands of your academic journey? Don't worry, we've got your back! Exam Question Bank is your trusted partner in achieving academic excellence for all kind of technical and non-technical subjects.
Our comprehensive range of academic services is designed to cater to students at every level. Whether you're a high school student, a college undergraduate, or pursuing advanced studies, we have the expertise and resources to support you.
To connect with expert and ask your query click here Exam Question Bank
