Build A Framework That Classifies Gender Based On Handwritten Text Project
- Country :
Australia
1.1 Aims and Objective
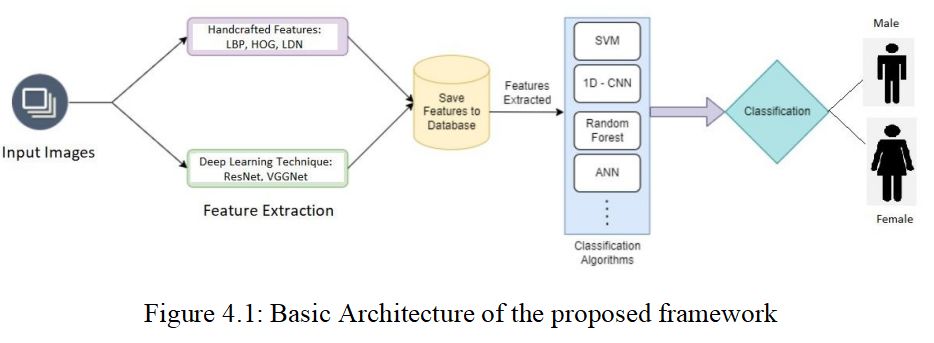
The aim of the project is to build a framework that classifies gender based on handwritten text. The task involves using handwritten text images as the input. Next, features will be extracted from the images, and these features will be used to classify the images with multiple classifiers such as SVM (Support Vector Machine), 1D-CNN, RF (Random Forest), and DT (Decision Tree). Various feature extraction techniques such as LBP (Local Binary Pattern) [11], LDN (Local Directional Number) [12], HOG (Histograms of oriented gradients) [13], ResNet [14], VGGNet [15], and combination of these algorithms may be used and compared to determine which yields the best results.
The objectives of this study are as follows:
- Propose a novel framework for the classification of gender based on handwriting using deep and handcrafted feature fusion.
- To implement a 1D-CNN model that is capable of classifying gender based on input data.
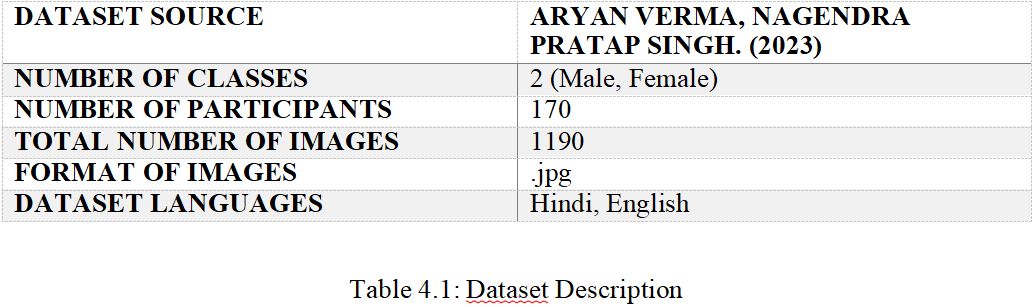
- To evaluate the proposed framework using the dataset. Dataset source - Aryan Verma, Nagendra Pratap Singh. [31]
Chapter 4
Evaluation Strategy
4.1 Overview
A gender classification system using a two-stream technique for image-based data is the framework suggested for this study. The proposed method involves extracting both handcrafted features and deep learned features that uses a two-stream approach that uses both handcrafted features such as LBP [11], LDN [12], HOG [13] , and deep learned features i.e., ResNet [14], VGGNet [15] to capture appearance information. The 1D-CNN classification algorithm is used to classify the extracted data. As far as we know, this is the first time such an approach has been used for gender classification using image data as input.
4.2 Dataset
The study proposed for this research will only use a single dataset for both training and testing the framework. This means that all the results and conclusions drawn from the framework will be based solely on this specific dataset.
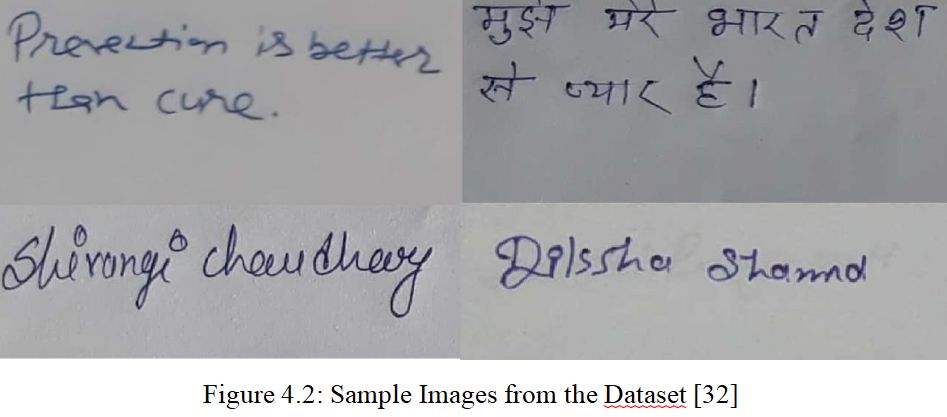
The dataset consists of 1190 manually gathered images of offline handwritten writings in Hindi and English. Each sample consists of seven images, each of which includes a number, quote, college name, and person's name in both languages. Samples are drawn from 170 people, 137 of them are men and 33 of whom are women. The dataset aims to build a gender classification system using computer algorithms to have practical implications.
4.3 Evaluation Metrics
To assess the efficacy of our model, we will employ several performance metrics to gauge its effectiveness compared to other leading models. These metrics include:
- Classification accuracy
- Confusion matrix
4.3.1 Classification Accuracy
Assessing the performance of a classifier in predicting outcomes across data is often done using the accuracy measure, which is the simplest way. This involves comparing the projected and actual classes of each data point and counting any correct predictions as one. In cases where datasets are imbalanced and have significantly different numbers of samples in each class, accuracy may not be a reliable metric for evaluation. This is because the minority classes can be misclassified, resulting in a high accuracy score that may not accurately reflect the model's performance. Therefore, the limitations of accuracy as a measure of performance are emphasized in such situations. In the context of evaluating a model's performance for class-imbalanced datasets, it is advisable to exercise caution when relying solely on accuracy as a metric of assessment. Other evaluation metrics should also be taken into consideration to obtain a comprehensive view [34].
4.3.2 Confusion Matrix
A table that illustrates how well a machine learning model performs on a particular testing dataset is called a confusion matrix. The performance of classification models, which aim to predict categorical labels for each input instance, is typically assessed using this kind of matrix. The matrix displays the total amount of true positives (TP), true negatives (TN), false positives (FP), and false negatives (FN) that the model generated on the test dataset. In essence, it offers a succinct description of how the model performed on the dataset [33].
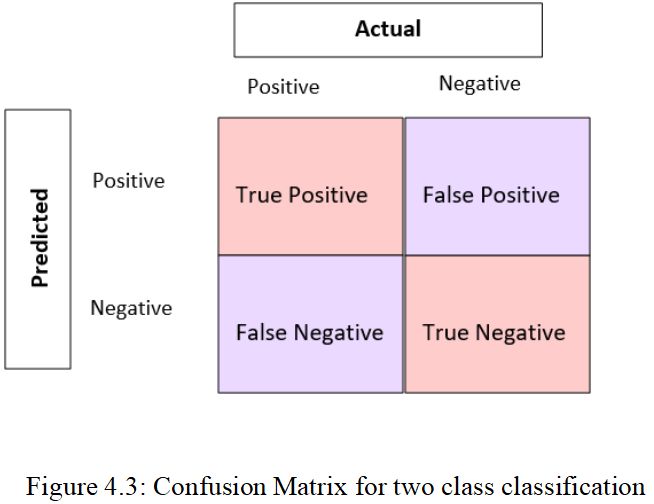
True Positive (TP): It is the number of times where the model correctly identifies a positive case.
True Negative (TN): When the predicted value is negative, and the actual value is also negative.
False Negative (FN): The prediction is for a negative value, but the actual value turned out to be positive.
False Positive (FP): It's when the model incorrectly identifies a sample as belonging to the positive class.
Are you struggling to keep up with the demands of your academic journey? Don't worry, we've got your back! Exam Question Bank is your trusted partner in achieving academic excellence for all kind of technical and non-technical subjects.
Our comprehensive range of academic services is designed to cater to students at every level. Whether you're a high school student, a college undergraduate, or pursuing advanced studies, we have the expertise and resources to support you.
To connect with expert and ask your query click here Exam Question Bank
