ITO5047 - Fundamentals Of Artificial IntelligenceAssessment
- Subject Code :
ITO5047
- Country :
Australia
Question 1:
Classification, Decision Trees, Na?ve Bayes, k-NN, WEKA Consider the dataset postoperative-patient-data_simplified.arff available on moodle. This dataset contains healthstatus attributes of post-operative patients in a hospital, with the target class being whether the patients should be discharged (S) or remain in the hospital (A). Additional documentation regarding these attributes appears in the arf file.
- Before you run the classifiers, use the weka visualization tool to analyze the data, and report briefly on the types of the different variables and on the variables that appear to be important.
- Run J48 (=C4.5, Decision Tree), Na?ve Bayes and IBk (k-NN) to learn a model that predicts whether a patient should be discharged. Perform 10-fold cross validation, and analyze the results obtained by these algorithms as follows. Note: Click on the Choose bar to select relevant parameters. Explanations of parameters you should try appear below. You should report on performance for at least two variations in total of the operational parameters minNumObj and unpruned for J48, and at least two variations in total of KNN and distanceWeighting for k-NN.
J48
- binarySplits: whether you use binary splits on nominal attributes when building the trees.
- minNumObj: the minimum number of instances per leaf.
- unpruned: whether pruning is performed (try TRUE and FALSE).
- debug: if set to TRUE, the classififier may output additional information.
- saveInstanceData: whether to save the training data for visualization.
Na?ve Bayes (parameter variations are not relevant to this lab)
k-NN (IBk) (under lazy in weka)
- KNN: the number of neighbours to use.
- crossValidate: whether leave-one-out X-validation will be used to select the best k value between 1 and the value specified in the KNN parameter.
- distance Weighting: specifies the distance weighting method used (when k > 1).
- debug: if set to TRUE, the classifier may output additional information.
- J48 (=C4.5)
- Examine wekas output (e.g., Decision Tree), and indicate which are the main variables.
- What is the accuracy of the output produced by weka (e.g., Decision Tree)? Explain the results in the confusion matrix.
- Na?ve Bayes
- Explain the meaning of the probability distributions in the output, illustrating it with reference to the BP STBL attribute. Note that WEKA does smoothing when computing probabilities for Naive Bayes. You should calculate the probabilities from the data, not from WEKA.
- Calculate (by hand) the probability that a person with the following attribute values would be discharged, and the probability that they would remain in hospital. Show your calculations.
L-CORE = mid
L-SURF = low
L-O2 = good
L-BP = high
SURF-STBL = stable
CORE-STBL = stable
BP-STBL = mod-stable - Run the Na?ve Bayes classififier to confifirm the prediction in item 2(b)ii. What is the accuracy of the Na?ve Bayes classififier? Explain the results in the confusion matrix.
- k-NN
- Find three instances in the dataset that are similar to the above patient (you can do this visually), and use the Jacard coefficient to calculate (by hand) the predicted outcome for this patient. Show your calculations.
- What is the accuracy of the k-NN classififier for difffferent values of k? Explain the results in the confusion matrix.
Draw a table to compare the performance of J48, Na?ve Bayes and IBk using the summary measures produced by weka. Which algorithm does better? Explain in terms of wekas summary measures. Can you speculate why?
Question 2:
Classification, Decision Trees, Na?ve Bayes, k-NN, WEKA Consider the dataset tic-tac-toe.arff available on moodle. Each example in this dataset represents a different game of tic-tac-toe (http://en.wikipedia.org/wiki/Tic-tac-toe), where the player writing crosses (x) has the fifirst move. Only those games that dont end in a draw are included, with the positive class representing the case where the fifirst player wins and the negative class the case where the first player loses. The features encode the status of the game at the end, so each square contains a cross x, a nought o or a blank b.
- Before you run the classifiers, use the weka visualization tool to analyze the data.
- Which attributes seem to be the most predictive of winning or losing? (hint: if you were the x player, where would you put your fifirst cross and why?)
- What can you infer about the advantage (or otherwise) of being the fifirst player?
- Run J48 (=C4.5, Decision Tree), Na?ve Bayes and IBk (=k-NN) to learn a model that predicts whether the x player will win. Perform 10-fold cross validation, and analyze the results obtained by these algorithms as follows. Note: When using J48, click on the Choose bar to try different values of minNumObj (default is 2); and when using IBk, try different values of KNN (default is 1).
- J48 (=C4.5)
- Examine the Decision Tree and indicate the main variables.
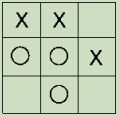
- Trace the Decision Tree for the following game. What would it predict?
- What is the first split in the Decision Tree? Calculate (by hand) the Information Gain obtained from the first split in the tree. Show your calculations.
- What is the accuracy of the Decision Tree? Explain the results in the confusion matrix for the best option you tried.
- Na?ve Bayes ,
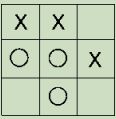
- Calculate (by hand) the probability of a win for the following game, and the probability of a loss. Show your calculations.
- Run the Na?ve Bayes classifier to confirm the prediction in item 2(b)i. What is the accuracy of the Na?ve Bayes classifier? Explain the results in the confusion matrix.
- k-NN
- Find three instances in the dataset that are similar to the following game, and use the Jaccard coefficient to calculate (by hand) the predicted outcome for this game. Show your calculations.
- What is the accuracy of the k-NN classififier? Explain the results in the confusion matrix.
- J48 (=C4.5)
- Draw a table to compare the performance of J48, Na?ve Bayes and IBk using the summary measures produced by weka. Which algorithm does better? Explain in terms of wekas summary measures. Can you speculate why?
Question 3: Regression
Consider the dataset abs.arff available on moodle. This dataset contains continuous-valued economic attributes of a country, with the target variable being the unemployment rate. Additional documentation regarding these attributes appears in the arf file.
- Perform a linear regression (Choose ? functions ? LinearRegression in weka) to learn a linear model of the unemployment rate as a function of the other variables. You can use the default parameters given in weka. What is the resultant regression function?
- Using the resultant regression function, calculate by hand the Absolute Error for the year 1986.
- Calculate the Mean Absolute Error (MAE) and Root Mean Square Error (RMSE) obtained by the regression function (you can use the excel spreadsheet provided on moodle). How is MAE different from RMSE? (do these functions emphasize different aspects of performance?)
Question 4: Clustering
The dots in the following plot are data points to be clustered using the K-means algorithm. C1 and C2 indicate initial cluster centroids.
- Show the first step of the K-means algorithm by indicating which data points belong to which cluster. Specifically, write the names of the data points in the cluster whose centroid is C1, and the names of the datapoints in the cluster whose centroid is C2.
- Show the next step of the K-means algorithm by writing the approximate x, y coordinates of the new class centroids; and entering the names of the data points in each cluster.
Are you struggling to keep up with the demands of your academic journey? Don't worry, we've got your back! Exam Question Bank is your trusted partner in achieving academic excellence for all kind of technical and non-technical subjects.
Our comprehensive range of academic services is designed to cater to students at every level. Whether you're a high school student, a college undergraduate, or pursuing advanced studies, we have the expertise and resources to support you.
To connect with expert and ask your query click here Exam Question Bank
