PSYU/X2248 2024 Data Analysis Report
Part I:
There has been a significant shift in how people work in recent years. Technological advancements, such as
video-conferencing software and high-speed internet, have enabled people to work from anywhere and at
any time. This, along with a reduced transparency of job expectations, has led to a blurring of the line
between work and personal life (Ng et al., 2007). As a result, there is a growing need to understand
workaholism, which is defined as a preoccupation with work that results in an over-commitment of time,
energy, and resources at the expense of other life activities (Balducci et al., 2020).
Research suggests that workaholism is influenced by a combination of an individual's dispositions and sociocultural experiences. One socio-cultural factor that has been found to contribute to workaholism is an
overwork climate, which values long hours and a preoccupation with work at the cost of recovery and
personal time. This type of work climate has shown a positive correlation with workaholism (Mazzetti et al.,
2014; Afota et al., 2021). It has also been proposed that an individual's group identification may be
associated with workaholism. Those with a high group identification may be more likely to adopt and adhere
to their workplace's overwork climate, contributing to workaholism (Junker et al., 2023). Additionally, a fear
of failure may predict workaholism, with this motivation developing from the internalisation of external
workplace standards necessary to obtain social approval (Mazzetti et al., 2020).
Please take a look at the first_dataset.dta. In this dataset, the variable workaholism is the level of
workaholism of white-collar employees, measured by an established workaholism scale (scores range from
10-40, where higher scores represent greater workaholism). The variable climate is the degree to which the
employee's work environment is characterised by overworking (scores range from 1-100, where higher
scores represent a greater overwork climate). The variable failure is the degree to which ones motivation
to achieve is due to a fear of failure (scores range from 10-40, where higher scores represent higher fear of
failure). Finally, the variable group is a dichotomous variable indicating whether the participants have low
or high group identification.
Although assumptions-checking is an important part of data analysis, for the purpose of this report, you
dont need to report any assumptions-checking results.
Step A. Based on this background, write a one-sentence research prediction that this dataset would have
been collected to address. (Please make sure that all the variables in the dataset are used to answer this
question and complete the next step of data analysis.) [6 marks]
Step B. Please conduct the appropriate statistical analysis to test the research question you wrote in
response to step A. Then, summarise the results of these analyses addressing the hypotheses, like how you
would write a RESULTS section of a research report in APA7 Style. [32 marks]
Step C. In plain language, please use 1-2 sentences to communicate these findings and their real-world
implications to a non-expert audience, such as advising a workplace manager on how to make changes to
improve employees working environment. [4 marks]
Part II:
Bhm, Rusch, and Grerk (2016) investigated the psychological mechanisms underpinning intergroup
conflict, with a particular focus on the role of defensive motivations. Through an innovative laboratory
experiment that utilises an interactive game between participants, the research showed that, despite being
costly to themselves, individuals were more likely to engage in retaliatory and pre-emptive aggressive
actions when they perceived their group as being threatened or when anticipating potential threats from an
outgroup. The experiment also demonstrated that aggression levels could be mitigated by removing the
perceived threats from outgroups, leading to reduced intergroup aggression and more peaceful outcomes.
Please take a look at the second_dataset.dta. This is a dataset from a project that aims to follow up on
Bhm et al.s (2016) findings. More specifically, this project aims to answer the question of how ones
perceived threat level (e.g., participants are led to believe that the outgroup has a high, medium, or low
probability of initiating aggression first) and whether there is communication between different groups (yes,
no) affects individuals pre-emptive aggressions. A similar laboratory experiment using the interactive game
was conducted in this project, with the pre-emptive aggressions being measured by the number of points
that participants allocated to the outgroup (higher points indicate a higher level of pre-emptive aggression
towards the outgroup). The researchers predict that a high perceived threat will increase the level of
aggression compared to medium- and low-threat conditions, confirming the original study's findings. Overall,
being able to communicate with the outgroup before the decision should reduce participants overall preemptive aggression compared to when communication is lacking, due to increased understanding and reduced misinterpretations of intentions. Finally, the effect of communication may be modulated by the
level of threat that one is perceiving, such that the benefit of communication compared to none will only be
present when they feel that the threat is low, but not when they feel the outgroup has a medium or high
probability to strike first.
Although assumptions-checking is an important part of data analysis, for the purpose of this report, you
dont need to report any assumptions-checking results.
Step A. Please conduct the appropriate statistical analysis (as well as all necessary follow-up analyses) to test
the above research hypotheses. Then, summarise the results of these analyses addressing these hypotheses,
like how you would write a RESULTS section of a research report in APA7 Style. [38 marks]
Step B. In plain language, please use 1-2 sentences to communicate these findings and their real-world
implications to a non-expert audience, such as advising policymakers on how to promote peace between
conflicting groups. [4 marks]
Part III:
Take a look at the following graph produced after running a factorial ANOVA analysis.
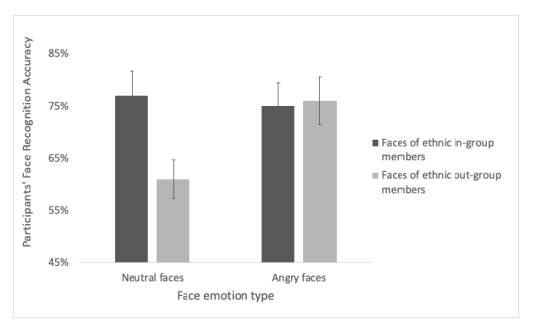
Step A. Write a one-sentence research question that this graph could have been used to address. [4 marks]
Step B. Explain the three effects, including their directions, represented in this graph. Write one sentence
per effect. [14 marks]
Are you struggling to keep up with the demands of your academic journey? Don't worry, we've got your back!
Exam Question Bank is your trusted partner in achieving academic excellence for all kind of technical and non-technical subjects. Our comprehensive range of academic services is designed to cater to students at every level. Whether you're a high school student, a college undergraduate, or pursuing advanced studies, we have the expertise and resources to support you.
To connect with expert and ask your query click here Exam Question Bank
