STA10003 Foundations Of Statistics Work Integrated Learning Assessment
- Subject Code :
STA10003
- Country :
Australia
Question 1: Prescribed Anti-clotting Drugs
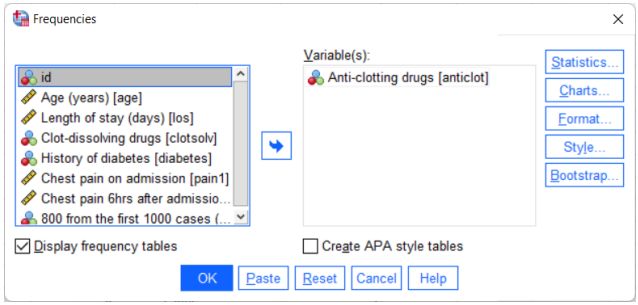
In this question, the objective is to summarize the anti-clotting drugs variable. This variable is indicating the anti-clotting drug types to the patient admitted to the hospital by suspecting heart attack (myocardial infarction). To do this, we are using the descriptive statistics approach with frequencies on SPSS. Moreover, suitable graphs are also provided with for analysis. To do descriptive statistics on SPSS, go to analyze > descriptive > frequencies. And, select anti-clotting variable and then click on the option that shows as Charts to select the bar charts. This process is demonstrated in the below screenshot (Bhandari, 2023).
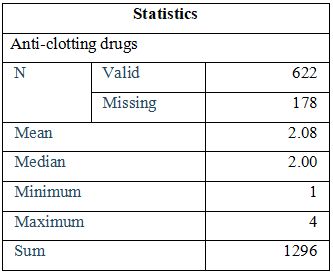
The output of the descriptive statistics of Anti clotting drug variable is exhibited in the below table.
Summary Table
Frequency Table
The frequency table exhibited below:
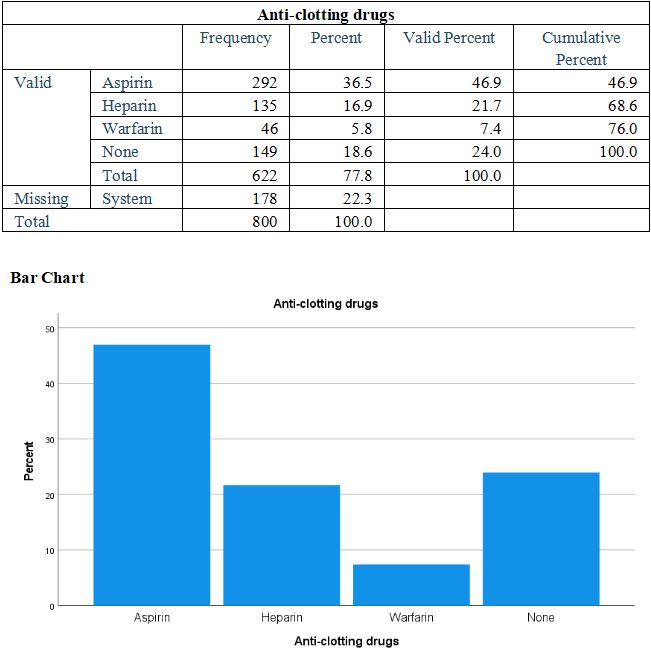
Based on the above shown tables, the anti-clotting drug types are divided into four types such as follows:
- Aspirin
- Heparin
- Warfarin
- None
Based on the observations, aspirin have the count 292, heparin have the count 135, warfarin have the count 135, and none as 149 count of anti - clotting drugs that are used for the patients in the hospital. From the above represented bar chart, the highest number of anti-clotting drugs that is given to the patients is aspirin when compared with the other types of anti-clotting drugs. Further, the lowest count of anti-clotting drug that is given to the patients is warfarin.
Question 2: Patient Age
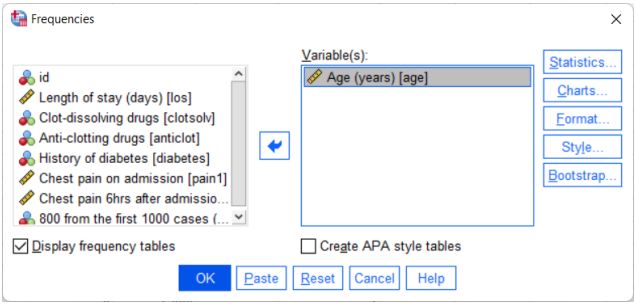
In this question, the objective is to summarize the patient age (i.e., it is a variable used here). This variable indicates the age of the patients in years (i.e., the patient admitted who were admitted to the hospital for suspecting heart attack or myocardial infarction). To determine this, the descriptive statistics with frequencies is used on SPSS, and it even provides suitable graphs for analysis. For conducting descriptive statistics on SPSS, go to analyse > descriptive > frequencies. And, select the Age variable and then click on the charts to select the bar charts, as demonstrated in the below screenshot (Libguides: SPSS Etutor: Descriptive statistics, 2023).
The result of the descriptive statistics for determining the patient age is demonstrated as follows:
Summary Table
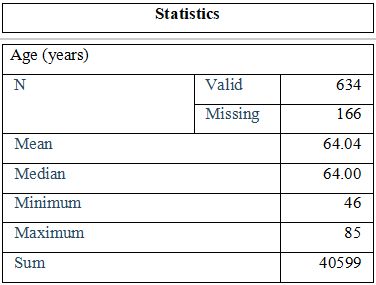
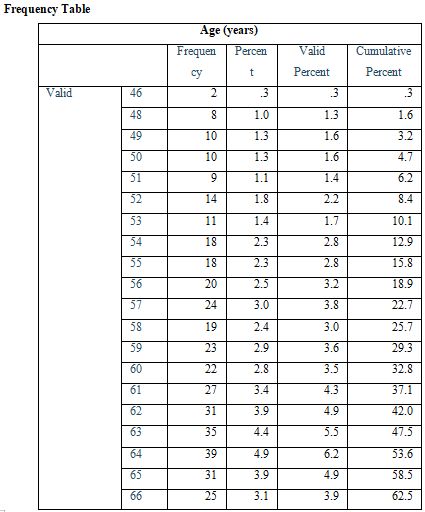
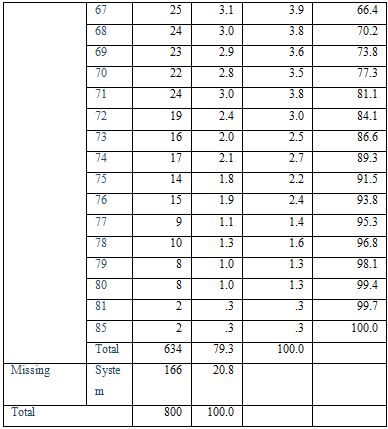
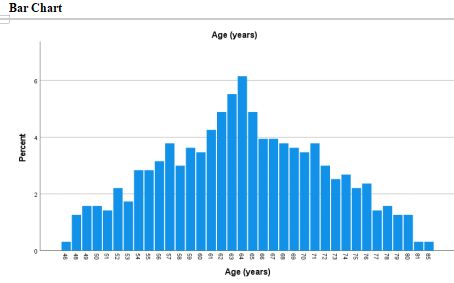
According to the above results, the patient age variable is summarized. The minimum age of patients admitted to the hospital is 46 and the maximum age of the patients admitted to the hospital is 84. Based on the bar chart and frequency table, the highest age of the patient is 64, 39 patients are admitted to the hospital with the age 64. And the lowest number of patients age is 81 and 85. When compared with the other patients age, only 2 patients are admitted to the hospital with the age 81 and 94.
Question 3: Length of Stay in the Hospital
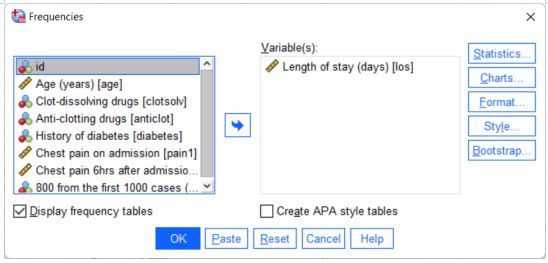
In this question, the aim is to summarize the los variable. This variable indicates the length of stay in a hospital who are suspected for heart attack (myocardial infarction). To do this, the descriptive statistics with frequencies is used on SPSS, and it also provides suitable graphs for this analysis. To do descriptive statistics on SPSS, go to analyse > descriptive > frequencies. And, select Length of stay(days) variable and then click on Charts to select the bar chart. This process is depicted in the below screenshot.
The result of the LOS variable is represented below:
Summary Table
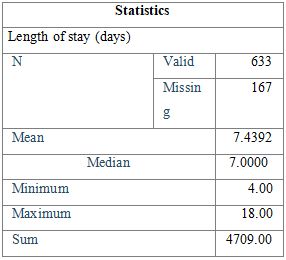
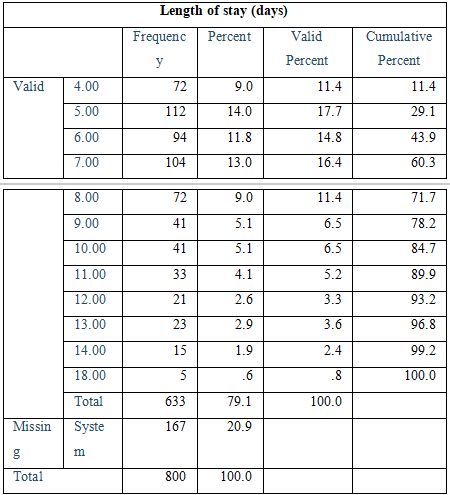
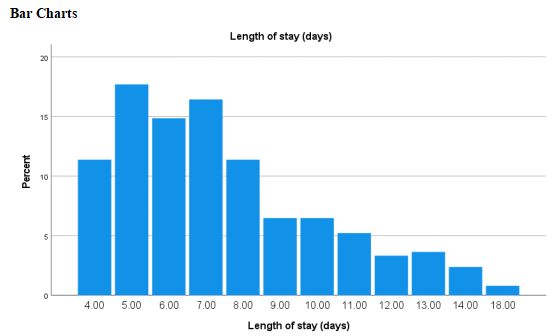
According to the above results, the patients length of stay variable is summarized. The minimum length of stay (i.e., in days) admitted to the hospital is 4 days and the maximum length of the stay (in days) admitted to the hospital is 18 days. Based on the bar chart and the frequency table, the highest number of the length of stay in days is determined to be 5, and 112 patients have been admitted to the hospital with 5 days of stay. Further, the lowest length of stay in the hospital is determined to be 18 days. When compared with the other length of stay, only 2 patients are admitted to the hospital with the longest number of stay in the hospital and it is 18 days.
Question 4
In this question, it is asked to determine which of the themed escape room did Ellie score the performance best.
This case study is about a game of escaping a room, where people are locked and only if the given puzzle is solved, they can find the key for unlocking the room. Respectively, a series of puzzles are given that help in escaping the room. A character named Ellie is introduced who is interested to go to escape room. Last year, Ellie completed 4 escape rooms and they are as follows:
- In 83 minutes, she completed the clown themed escape room
- In 112 minutes, she completed the apocalypse themed escape room
- In 121 minutes, she completed the fantasy themed escape room
- In 94 minutes, she completed the zombie themed escape room
In general, the completion times of the participants who completed the clown themed escape room are normally distributed by using the mean equal to 96 minutes, whereas the standard deviation i.e., s equals to 14 minutes.
The completion times of the participants who completed the apocalypse themed escape room are normally distributed by using the mean equal to 134 minutes, whereas the standard deviation i.e., s equals to 18 minutes.
The completion times of the participants who completed the fantasy themed escape room are normally distributed by using the mean equal to 83 minutes, whereas the standard deviation i.e., s equals to 32 minutes.
The completion times of the participants who completed the zombie themed escape room are normally distributed by using the mean equal to 64 minutes, whereas the standard deviation i.e., s equals to 21 minutes.
This case study intends to determine the best performance time of Ellie in comparison with the other participants who completed the escape room.
The related explanation is provided as follows:
Based on the case scenario, it is found that Ellie completed the following themed escape rooms with the respective timings:
- In 83 minutes, clown themed escape room was completed.
- In 112 minutes, the apocalypse themed escape room was completed.
- In 121 minutes, the fantasy themed escape room was completed.
- In 94 minutes, the zombie themed escape room was completed.
The following exhibits the completion times of the themed escape rooms, respectively:
To determine, which themed escape room did Ellie perform well by determining the mean and standard deviation for Ellies completion time from each of the completed themed escape rooms.
For Clown themed escape room,
Standard Deviation = 83 mins / 4 = 20 min
For Apocalypse themed escape room,
Standard Deviation = 112 mins / 4 = 28 mins
For Fantasy Themed Escape Room,
Standard Deviation = 121 mins / 4 = 30 mins
For Zombie Themed Escape Room,
Standard Deviation = 94 mins / 4 = 23 mins
According to the above standard deviations result, Ellie performed well on Apocalypse and clown themed escape room. Because, it has the highest standard deviation when compared with the other people who did the same clown and apocalypse themed escape room game.
Question 5
In this question, the answer will be about analyzing the happy valley fruit company complaints from the customers. Basically, this company make 750 ml bottles of strawberry cordial. And, this product is known to be one of the top selling cordials. But there are many complaints against the strawberry cordial that are received from the customers. All the customers stated that the bottles do not contain the stated 750 ml of cordial, instead they pack a lesser quantity. Thus, the production line manager is required to take necessary actions against this issue. By considering this issue, the manager has doubts that the machinery that fills these containers is not functioning correctly, Therefore, the production line managers take a random sample of 1000 bottles of strawberry cordial during the month of August to check if the filled content is 750 ml or not.
Are you struggling to keep up with the demands of your academic journey? Don't worry, we've got your back! Exam Question Bank is your trusted partner in achieving academic excellence for all kind of technical and non-technical subjects.
Our comprehensive range of academic services is designed to cater to students at every level. Whether you're a high school student, a college undergraduate, or pursuing advanced studies, we have the expertise and resources to support you.
To connect with expert and ask your query click here Exam Question Bank
