Statistical Analysis Assignment
- Country :
Australia
Overview
In this assessment you will perform a statistical investigation on a dataset that you compile from GapMinder. In the statistical investigation, you will perform exploratory data analysis, a set of generated hypothesis and statistical interrogation of the hypothesises. Your report will use RStudio to generate visualisations and statistical outcomes, while your written report will communicate the interpretations of the RStudio outputs and your justifications for your statistical analysis.

Learning outcomes
Understand and apply new data science skills, knowledge, and techniques to solve problems in data science using statistical hypothesis testing:
Data
For this assessment you will generate data derived from Gapminder (https://www.gapminder.org/data/). Gapminder is an independent educational non-profifit fifighting global misconceptions. Gapminder combines data from multiple sources into unique coherent time-series that is segmented by countries. The range of data categories is highly varied, such as Communication, Energy, Environment, Health, Education, plus many more categories.
The data you are to generate is as follows:
Tasks
There are three main tasks (1) Describing your data, both numerically and visually, (2) performing a linear regression between two variables and (3) performing a statistical investigation on a hypothesis.
I. Describing your data, both numerically and visually
In this section will describe your data, the data distributions using numerical summaries and visualisations. Be sure to include:
II. Linear regression between two variables
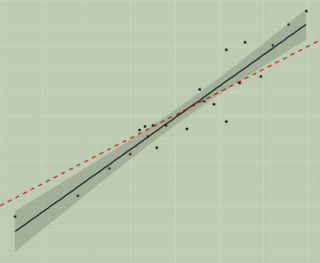
In this section, perform a linear regression between the two variables derived from step 1 in the Data section. Be sure to include:
III. Statistical investigation on a hypothesis
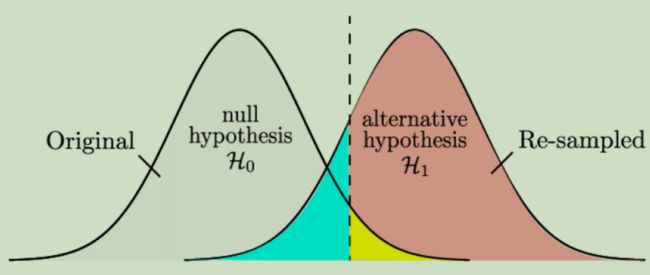
In this section, perform a statistical hypothesis using the categorical HDI variable (from step 2 in the Data section) and one of the numeric variables derived from step 1 in the Data section. Be sure to include:
Structuring the Report
The report should have the following sections marked clearly
Title
In todays busy world, it is very important to make the most of your title. Make the title concise, informative and an accurate representation of the contents of the report
Executive Summary
The executive summary provides a short sharp overview of the contents in the report and will be around 300-500 words. There will be five parts:
Introduction
The introduction sets the scene for the investigative efforts. It provides motivation for the work and relevant background information and references that will enable the reader to put in context the key objectives and findings in your report. Address the important issues that have motivated your investigation. At the end of the introduction clearly state the key objectives of the paper.
Note:
Data
This section should provide clear details about the data that have formed part of your investigation and where the data were sourced. This section will describe:
Linear regression between two variables
In this section, perform a linear regression between the two variables derived from step 1 in the Data section. Be sure to include:
Statistical investigation on a hypothesis
In this section, perform a statistical hypothesis using the categorical HDI variable (from step 2 in the Data section) and one of the numeric variables derived from step 1 in the Data section. Be sure to include:
NOTE:
You may include figures, tables, and code sections in your report. Figures, tables, and code sections do not contribute to the word count. Code sections must be presented as text, screen capture of code will not be graded. All figures, tables and code must have a caption and be referenced in your discussions using the appropriate captions. Figures, tables, and code sections that are not referenced in discussions do not contribute to grading. Appendices are not graded.
- demonstrate sound knowledge of the basic principles that underpin sample selection, experimental design, statistical theories, data visualisation and linear modelling.
- effectively integrate and execute statistical theories and processes in RStudio.
- retrieve, analyse, synthesise, and evaluate outputs produced from RStudio.
- integrate statistical principles, methods, techniques, and tools covered in this course to plan and execute a statistical analysis.
- evaluate, synthesise, and communicate findings from statistical investigations in a form suitable for specialist and non-specialist audiences.
- Download two individual indicators from the indicators available at Gapminder (https://www.gapminder.org/data/). You can choose any two series EXECPT the human development index (HDI). The two series you choose will be used for regression analysis, and one of the series will be used with HDI data (from step 2) for hypothesis testing.
- Download the human development index (HDI) from the society indicator, then create a categorical variable from the human development index data. You are free to choose the year to derive the categorial data. E.g., convert numbers between 0 and 0.33 to a "1", numbers greater than or equal to 0.33 but less than 0.66 to a "2" and numbers greater than or equal to 0.66 to a "3". The number of categories and split points are ultimately your choice but should be defensible.
- The sample size
- The variables used in your analysis, and the variable type.
- Tables for relevant summary statistics.
- Any data pre-processing that was done prior to analysing your data. Pre-processing may include but is not limited to ways of handling missing data, transforming data.
- Discussion on the statistical limitations of the data
- A visualisation of the variables used in the linear regression analysis, such as scatter plots, histograms, boxplots.
- A discussion on the statistical assumptions for the regressions analysis that you choose.
- Statistical evidence relating to the validity of the statistical assumptions. For non-parametric regression include the statistical evidence demonstrating the violation of the parametric case.
- Interpretation of the statistical output of the regression analysis
- The hypothesis(es) to be tested
- A visualisation of the variables used for the hypothesis, such as a scatter plot, histograms, or boxplots.
- A discussion on the statistical assumptions for the statistical analysis that you choose to investigate the hypotheses(es).
- Statistical evidence relating to the validity of the statistical assumptions. For nonparametric procedures this will focus on how the statistical assumptions for the corresponding parametric test has been violated.
- Interpretation of the statistical output of the hypothesis analysis
- Introductory statement: background to the study, important issue(s) the report addresses. Approximately 2 to 4 sentences.
- Purpose of the report: state the objectives and associated hypotheses. One sentence with multiple bullet points or approximately three separate sentences.
- Methodological approach: overview the data and analysis methods. 1-2 sentences with multiple bullet points or ~3 separate sentences.
- Findings: list the main overarching findings from your statistical investigation. Approx. 3 sentences.
- Conclusions and Implications: what conclusions can be drawn from your investigation? How can the findings in your report to deliver a benefit to people, things, systems, or processes? Approx. 2-3 sentences.
- Do not put any results from your investigation in the introduction.
- Do not discuss the data and methods in this section.
- Do not discuss your conclusions or key findings in the introduction.
- The sample size.
- The variables used in your analysis, and the variable type.
- Tables for relevant summary statistics.
- Any data pre-processing that was done prior to analysing your data. Pre-processing may include but is not limited to ways of handling missing data, transforming data.
- Justifications for any pre-processing or data transformations
- Discuss the statistical limitations of the data
- A visualisation of the variables used in the linear regression analysis, such as scatter plots, histograms, boxplots.
- A discussion on the statistical assumptions for the regressions analysis that you choose.
- Statistical evidence relating to the validity of the statistical assumptions. For non-parametric regression include the statistical evidence demonstrating the violation of the parametric case.
- Interpretation of the statistical output of the regression analysis
- The hypothesis(es) to be tested
- A visualisation of the variables used for the hypothesis, such as a scatter plot, histogram, or boxplot.
- A discussion on the statistical assumptions for the statistical analysis that you choose to investigate the hypotheses(es).
- Statistical evidence relating to the validity of the statistical assumptions. For nonparametric procedures this will focus on how the statistical assumptions for the corresponding parametric test has been violated.
- Interpretation of the statistical output of the hypothesis analysis
