Threshold Profitability Assignment
- Country :
Australia
Q1
- At what volume of production will the threshold of profitability be reached?
Break even point or threshold profitability = Fixed Cost / Contribution per unit = 1,10,000 ( given)
Contribution per unit = average sales price of 25/unit / variable costs are 5 (Lee, Chang, Kao, & Lee, 2023)
= 20 per unit
Applying the formula = 1,10,000 / 20 = 5500 units - Assuming that annual sales are estimated at 20,000 units, being the distribution evenly over a year, on what date will the break-even point be reached
Annual Sales = 20,000 Units
Number of days in a year = 365
Number of units sold in a year = 20000/365
Number of units sold in a day = 55 days
Number of days Taken = Break even units / Units sold in one day
= 5500 / 55 = 100 days
(Lee, Chang, Kao, & Lee, 2023). - What would be the sales value or turnover corresponding to the threshold of profitability?
Sale value = Volume of Threshold of profitability or the Breakeven units Selling price per unit
= 5,500 units 25
= 137,500
The sale value or turnover corresponding to the threshold of profitability = 137,500
(Qiu, Hu, Liang, & Dow, 2023)
Q2
Determine the Net Cash Flows after taxes of the project described above. Calculate the net absolute return.
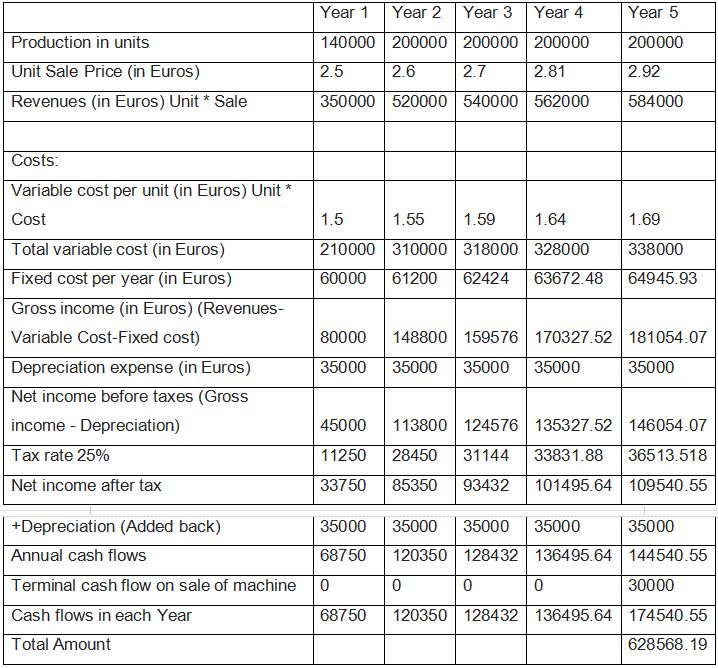
Total = 423568.19
The net absolute return is computed as the simple return on investment, without considering the holding period, discount rate, etc. into account. Returns in absolute terms are merely (Returns - Cost) / Cost *100. Returns in absolute terms are merely (Returns - Cost) / Cost *100. Therefore, net absolute return equals 100 times (423568 minus 200,000) divided by 200,000.
= 111.78 %
Working Analysis
Annual depreciation = (Initial cost - Residual Book Value) / Useful life of machine = (200,000 - 25,000) / 5 = $35,000.
Depreciation is added back to net income after taxes because the question requests for net annual cash flows and, as a non-cash item, depreciation must be added back to arrive at cash flows (after taxes). Since the machine will be sold for 30,000 at the end of the fifth year, the same amount is added to the cash flows at the end of the fifth year.
Q4
Computation of the ratios are as follows:-
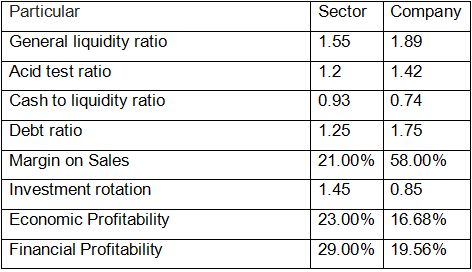
The company's general liquidity ratio (current assets / current liabilities) is 1.89 versus 1.55 for the industry (sector) as a whole. The general liquidity ratio indicated that the company can pay its current obligations on demand by liquidating its current assets more effectively than the industry as a whole. The Acid Test Ratio ((Current Assets-Inventories)/current liabilities) indicates that the company can pay off its current obligations significantly more quickly than the industry norm.
The cash-to-debt ratio of the industry is superior to that of the company because the company maintains a smaller cash balance than the industry. Company's debt ratio is lower than that of the industry. The company's total assets surpass its total liabilities by 1.75 times. The optimal debt ratio is 2. The ratio recorded by the company is 1.25, which is less efficient than the debt ratio recorded by the company (Arya, Fellingham, & Glover, 2018). The company's gross margin is 58%, which is significantly higher than the industry's 21%. But the company's net income on sales is 19.56 percent, compared to the industry average of 29 percent. The net profit ratio (financial profitability) suggests that other companies (industry) generate more income from investment in other (sources). The company's net profit is dependent on its primary business operations, which differs from the industry norm. The financial profitability of the company and the industry is superior to the economic profitability (Arya, Fellingham, & Glover, 2018).
The figures are computed by taking following figures :-
Financial Profitability
Sales 250000
Cost of goods sold 105000
Gross Margin 145000
Amortization 70000
Interest paid 9800
Net profit before tax 65200
Tax 16300
Proft after tax (NI) 48900
NI on Sales 20%
Return on fixed assets 29%
Long term debt 105
Short term debt 65
Total debt 170
Total Interest paid 9.8
Cost of debt 5.8%
Implicit cost 7,206
Q4
Calculate the Net Present Value of the investment, knowing that inflation is 3% cumulative annually and that the required profitability in the absence of inflation is 8%.
Firstly, computing the discounting rate adjusted with inflation= (1+ discount rate) (1+ inflation rate)
= (1+ .08)(1+.03)
= 1.1124
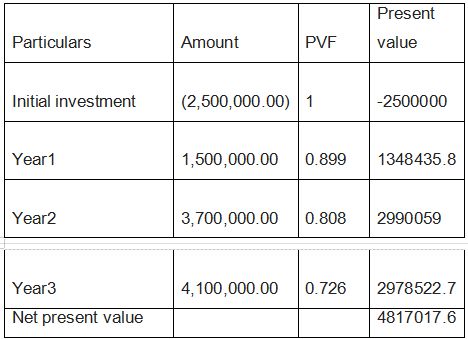
Calculate the actual internal rate of return of the previous investment. It is computed on the basis of the fact that the discount rate makes present value of inflows equal to the out flow . The initial disbursement Trial-and- error method should be used to calculated IRR 0 = - 2, 500, 000 + 1,200,000 31 700, 000 41 100, 000 + ( It IRR )' * ( 1 + IRR ) 2 ( 1+ IRR) 3 by trial-and-escrow solving the above equation. IRR = 86. 50% (Qiu, Hu, Liang, & Dow, 2023)
Q5
- It purchased and consumed 105,000 in basic materials for the production of its product and maintained an average stock level of 9,250. Determine the average storage period. Determine the average storage duration.
(Average inventory/cost of annual purchases) 360 days.
Average period of storage = (9250/105000)*360
Averagestorage periodis 32.1 days - The annual production cost is 198,000, and the average value of products currently in development is 11,000. Determine the mean manufacturing period.
Annual production cost = $80,000
Average product value = 11,000
Average production period = Cost of annual production / Average product value
Average manufacturing period = 198000/11000 = 18 Days - Taking into account that the company sold all of its annual output and that the average value of its finished products inventory was 18,500, the average sales period is calculated.
Average sales period = Average accounts receivables divided by (annual sales divided by 365 days).
The average sales period is equal to 18500/(198000/365) or 365 days. The average sales cycle is 34.1 days. - Using the assumptions that the company sold its products for 290,000 and that its consumers owed an average of 17,000, it calculates the average collection period.
Receivables turnover equals sales revenue divided by account receivables.
Receivables turnover equals 290 000 divided by17 000
Turnover of receivables = 17.05
Average collection period = 365/turnover of receivables
Average period of collection = 365/17.05
Average period of collection = 21 days - Considering the pointers from a to d for summation
Average period of economic activity = 32.1 + 18 + 34.1 + 21 = 105.2 days
Q6
Calculate the IRR of the previous project will be done on the trail and error method
The cash outflow in the base year = Initial disbursement of 2,000,000 The cash Inflow in the 4 years =
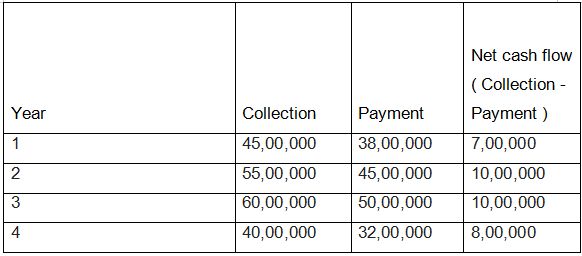 Applying the formula where the IRR is best when net present value is zero Formula is as follows:-
0 = -2,000,000 + 700,000 / (1 + IRR) + 1,000,000 / (1 + IRR)^2 + 1,000,000 / (1 + IRR)^3 + 800,000 / (1 + IRR)^4
Considering the IRR as 26.08 % and substituting the value we get as follows:- NPV becomes zero , therefore the discounting rate at this percentage will give optimum results (Arshad, 2012).
Are you struggling to keep up with the demands of your academic journey? Don't worry, we've got your back! Exam Question Bank is your trusted partner in achieving academic excellence for all kind of technical and non-technical subjects.
Our comprehensive range of academic services is designed to cater to students at every level. Whether you're a high school student, a college undergraduate, or pursuing advanced studies, we have the expertise and resources to support you.
To connect with expert and ask your query click here Exam Question Bank
