BAO1101 Accounting For Decision Making Assignment
- Subject Code :
BAO1101
- University :
Victoria University Exam Question Bank is not sponsored or endorsed by this college or university.
- Country :
Australia
PART 1 SHAREMARKET ASSIGNMENT SHEET - complete and ONLY submit sheets on p.5-7
Commence a share portfolio choosing 2 companies (for group of 2) or 3 companies (for group of 3) from the six listed above. The total value of your portfolio should be $10,000 for group of 2 students and $15,000 for group of 3 students, based on the closing share prices posted on the ASX (or Yahoo finance) website on Monday 15th May 2023. Check after 6pm to ensure that the latest price has been updated.
The paragraph below provides a brief background for your assignment, it is NOT expected in part 1. During the tracking period of Monday 15th May 2023 to Friday 9th June 2023, you are to monitor the performance of your portfolio and the overall performance of the Australian share-market (measured by the All-ordinary index). Can you maximize the value of your portfolio?
PART 2 COMPANY RESEARCH / GRAPHS / INVESTOR INFORMATION [55 marks]
- A brief description of the company in your portfolio. It should be presented in a table and should include: -
- Products and Services Provided by The Company [brief outline] 50-80 words for this section
- Name of Chief Executive Officer [or Managing Director]
- Salary of Chief Executive Officer [or Managing Director]
- Profit / Loss after Tax from 2022 Annual Report for the full financial year consolidated figures
- Latest Dividend Paid Dividend Per Share and Date Paid
- Size Of The Business By Total Assets from 2022 Annual Report consolidated figures
- Number Of Employees
- Share Price 52 weeks High and Low at the end of trading day Friday 9th June 2023 from the Yahoo Finance Database or other suitable site.
[100 words maximum for each company in your portfolio for this section] [10 marks] - For the tracking period only, using an Excel spreadsheet, prepare your own graphs of the daily share price movements for each of your shares. Information should be shown in a table with separate columns for Date and Closing Price ($).
For the tracking period only, using an Excel spreadsheet prepare your own graph of the daily movement of the All-Ordinaries Index. Information should be shown in a table with separate columns for Date and Closing Value [points] Copy and Paste Excel Tables and Graphs into a Word Document to include in your report. [10 marks] - For your company, provide an overview of the share price performance and describe the overall trend of the Australian share-market over the tracking period. Describe how your share performed against the All Ordinaries Index. Explain major movements in your share prices and the share-market with evidence from newspapers, business magazines, internet information or other relevant sources. Evidence should be included, and news articles should be provided as a screen shot and neatly presented in an appendix to your report. Harvard Referencing is required to acknowledge all sources of information used. Please be aware of penalties for Plagiarism. See Harvard Referencing links on VU Collaborate.
[400 words limit] [25 marks] - Calculate the Gain or Loss in $ and % made on your portfolio during the tracking period. [5 marks]
- Provide a recommendation [buy / sell / hold] for your shares. Support your recommendation with relevant information you have found in Part [C].
[50 words maximum for each company] [5marks]
PART 3 IDENTIFICATION OF KEY FINANCIAL DATA AND RATIO ANALYSIS [35 marks]
[A] IDENTIFICATION OF KEY FINANCIAL DATA
For the company you have selected, complete the following table of Key Financial Data. Find the figures from the 2022 Annual Report with results for the full financial year for 1 July 2021 to 30 June 2022. The consolidated figures are required.
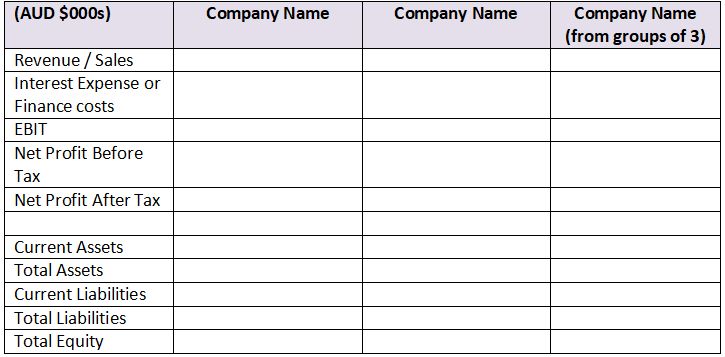
References are required to identify the source of all figures in your table. Attach Consolidated Income Statement and Consolidated Balance Sheet for each company with relevant figures highlighted. This must be included in the appendix of your report. [5 marks]
[B] RATIO ANALYSIS
From the Key Financial Data, calculate relevant ratios provide an overview of your companys:
*Profitability *Stability *Liquidity
At least 6 ratios should be used for this overview.
The ratios may vary depending on the availability of information provided in your companys Financial Statements. For each of the headings listed above, your overview should:
- identify the name of the ratio used and interpret your results
- provide any explanation of why these ratios may differ between your companies
- which do you consider to be the better investment? Explain your reasoning.
Are you struggling to keep up with the demands of your academic journey? Don't worry, we've got your back! Exam Question Bank is your trusted partner in achieving academic excellence for all kind of technical and non-technical subjects.
Our comprehensive range of academic services is designed to cater to students at every level. Whether you're a high school student, a college undergraduate, or pursuing advanced studies, we have the expertise and resources to support you.
To connect with expert and ask your query click here Exam Question Bank
