DATA 4400 Data-Driven Decision Making and Forecasting Assignment
- Subject Code :
DATA-4400
- Country :
Australia
Workshop Learning Outcomes
1.Describe traditional Statistics' role in prediction
2.Introduce Bayesian methods for prediction
3.Compare hypothesis testing between the methods
4.Introduce reasoning and inference for later use in business decision-making and forecasting
Glossary 1
Inference: A conclusion made based on evidence
Statistical Inference: Analysis of samples used to make conclusions about a population. Based on a particular model and strict assumptions
Use of inference in machine learning:
- Analysis of the training set, application to another data set and drawing conclusions
As this process does not start with strict assumptions, you are inferring something based on another similar large data set, rather than smaller subset (sample)
https://www.nature.com/articles/nmeth.4642
https://blogs.nvidia.com/blog/2016/08/22/difference-deep-learning-training-inference-ai/
Activity 1: Frequentist vs Bayesian Models
- Watch the video comparing Frequentist and Bayesian statistical models:
https://www.youtube.com/watch?v=r76oDIvwETI
- Q: From these examples, What appears to be the main difference in these approaches?
Review of Conditional Probability
- The probability of event A given event B is written P(A|B)
- Example:
- Let event A be a persons needs to take drug X, with P(A) = 0.1
- Let event B be a person has a high BMI, with P(B) = 0.6
- Let joint event A and B be the a person has high BMI and needs drug X, with P(A and B) = 0.3
- The P(A|B) is the conditional probability that you need to take drug X, given that your BMI is high. The conditional probability Formula is= 0.3/0.6 = 0.5
Activity 2: Calculating P(Tr |F)
- Assume event F is a person is female with probability P(F) = 0.4
- Event Tr is a student travels by train to KBS with probability P(Tr) = 0.1
- Joint event Tr and F is a student is female and travels by train to KBS with probability P(Tr and F) = 0.16
- Answer the following
Q1. Express P(Tr | F) in a single sentence
Q2. Calculate (Tr | F) using formula
Traditional View Summary
- The traditional view of statistics (and probability) is the frequentist approach where:
- The probability P of an uncertain event A occurring, P(A), is defined by the frequency of that event based only on the data at hand.
- Hence, the only information available is sample data.
- It is assumed there is a true underlying model with fixed population parameters that we cant observe perfectly.
- We make inferences about a population from the sampled data.
- All the randomness lies in the data.
Traditional View Example
- Example: Assume 40% of all babies born are boys from previous data.
- Suppose that we are interested in the event A: 'a randomly selected baby is a boy.
- The probability that the a randomly selected baby is a boy is P(A)= 40/100 = 0.4
Traditional View Limitation
- The frequentist approach for defining the probability of an uncertain event would be acceptable if we were able to record accurate information about a large number of past instances of the event.
- However, suppose no such historical database exists, then we have to consider a different approach, e.g. A Bayesian approach.
- We use a best guess and over time update our best guess using the latest data.
Thomas Bayes
.png)
- An English statistician, philosopher and Presbyterian minister who is known for formulating a specific case of the theorem that bears his name: Bayes' theorem (later in slides).
- Fun fact: Bayes never published what would become his most famous accomplishment; his notes were edited and published after his death.
Bayesian View
Bayesian probability allows us to reason about beliefs under conditions of uncertainty.
- Example: The Olympics https://www.pexels.com/search/Olympics/
- If we have observed that a particular event has happened, such as Australia came 4th in the medal table at the Sydney 2000 Olympics
- There is no uncertainty about this statement.
- However, suppose a is the statement Australia wins 36 Gold Medals at the 2020 Tokyo Olympics!
- No certainty exists about whether or not this statement is true.
Bayesian View Cont.
- Consider two people Anna and Glenis
- Suppose, for example, Anna has a strong belief in the statement a based on her knowledge of the current Olympic team and past achievements.
- Glenis, on the other hand, has a much weaker belief in the statement based on some inside knowledge about the status of Australian sport; for example, she might know that Australian sportsmen failed in bids to qualify for the last soccer World Cup!
Bayesian View Cont.
This Photo by Unknown Author is licensed under CC BY-SA
- Thus, in general, a person's subjective belief in a statement a will depend on some knowledge K.
- We write this as conditional probability P(a|K)
- Anna's belief in a is different from Glenis' because they are using different Ks.
- However, even if they were using the same K they might still have different beliefs in a.
- The expression P(a|K) represents a belief measure.
- For simplicity, when K remains constant we just write P(a), but you must be aware that this is a simplification.
Bayesian View Summary
- The information we have are the observations (data) + a prior belief
- There is no true underlying model and so population parameters are assumed to be unknown and random (as reflected by their distributions)
- The only knowable truth is the sample data since we observe it
- Rather than a sampling distribution, we use Bayes Theorem to update a probability of an event, given the data
Comparing Approaches in Words: England vs France
Problem: What is the probability of England beating France in Soccer?
Frequentist approach:
- Gather an appropriate sample of games between England and France.
- Calculate the frequency of England wins All E vs F games in sample
Bayesian approach:
- Make an informed guess about the chance of England winning (Prior probability)
- Observe the current game results and update the informed guess each time there is a new game between England and France
Activity 3: A/B Testing
Form groups and answer the following:
Q1. Write down two features of Bayesian Statistics in your own words.
Q2. Consider the following problem of A/B testing comparing customers conversions using new webpage designs (version Bs) with conversions using the original design, (version A).
Compare Frequentist A/B testing and Bayesian A/B testing, in general terms of the information and probabilities you would need.
.png)
This Photo by Unknown Author is licensed under CC BY-NC-ND
https://medium.com/glossier/bayesian-versus-frequentist-a-b-testing-for-the-anxious-glossier-data-scientist ec604c6ceec9
Bayes Theorem Derived
- Consider Conditional probabilities
.png)
- It is easy to define P(A|B) without reference to joint probability P(A and B) by rearrangement, i.e.
P(A|B) P(B) = P(A and B)
P(B|A) P(A) = P(A and B)
- Equating right hand sides, it follows that
Terminology for Bayes Theorem Example With Parameter
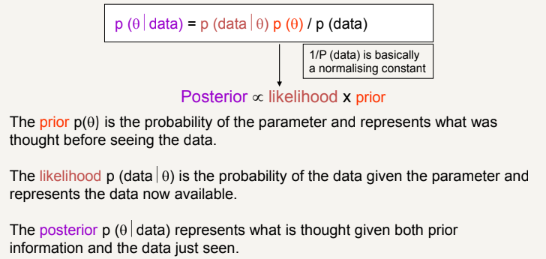
It relates the conditional density of a parameter (posterior probability) with its unconditional density (prior, since depends on information present before the experiment).
Worked Example of Bayes Theorem Page 1
- Suppose that we are interested in diagnosing cancer in patients who visit a chest clinic:
- Let A represent the event "Person has cancer
- Let B represent the event "Person is a smoker
- We want to compute the posterior probability P(A|B), since it is difficult to find this out directly.
- We know the probability of the prior event P(A)=0.1 on the basis of past data (10% of patients entering the clinic turn out to have cancer).
- We are likely to know P(B) by considering the percentage of patients who smoke suppose P(B)=0.5.
Worked Example of Bayes Theorem Page 2
- We are also likely to know P(B|A) by checking from our records the proportion of smokers among those diagnosed. Let P(B|A)=0.8.
- We can now use Bayes theorem to compute:
- Thus, in the light of evidence that the person is a smoker we revise our prior probability from 0.1 to a posterior probability of 0.16.
- This is a significant increase, however if this is accurate, theres only a 16% chance a person has cancer given that they smoke.
Activity 4: Bayes Theorem
- Let A represent the event "Person has cancer, and P(A) = 0.4
- Let B represent the event "Person is a smoker, and P(B) = 0.3
- Let P(B|A)=0.7.
- We can now use Bayes theorem to compute:
Q1..png)
Q2. This is a significant increase, so what are the implications in thiscase?
Hypotheses
This Photo by Unknown Author is licensed under CC BY-SA
What are Hypotheses?
A hypothesis is a statement (assumption) about a population parameter, e.g. the population average amount of soft drink in a small bottle is 325.02 ml
- Hypothesis testing is a type of statistical inference.
- It allows us, given a test threshold, to determine whether or not sufficient evidence exists for us to confirm a belief about a particular parameter.
- We form two opposing hypotheses:null hypothesis (H0) and alternative hypothesis (H1)
Frequentist Hypothesis Testing
- Start with null (H0) and alternative (H1) hypotheses
- Normally reject H0 or not, based on an arbitrarily chosen p value
- [So we choose our willingness to accept a false positive]
- This tells us nothing about the probability of H1
- The frequentist conclusion is restricted to the data at hand, it does not take into account previous, valuable information.
Bayesian Hypothesis Testing
- In general, we want to relate an event (E) to a hypothesis (H) and to P(E|H).
- The probability of a hypothesis H being true is determined.
- A probability distribution of the parameter or hypothesis is obtained.
- We can then compare the probabilities of different H for the same E.
- The conclusions depend on previous evidence
- The method brings different types of evidence (beyond data at hand) to answer the questions of importance.
- Given a PRIOR state of knowledge or belief, it tells us how to update beliefs based upon observations (current data).
Example: Patients With High BMI
Question: Are high BMI patients more likely to need medication?
- A random sample of 40 patients was taken, BMI and medications noted.
- Ten (10) patients had high BMI, and three (3) of those were on a drug treatment.
- The control group of thirty (30), did not have high BMI, and only one (1) was on a drug treatment.
.png)
Frequentist Approach
H0: Patients with high BMI are not more likely to need medication than control group
Hi: Patients with high BMI are more likely to need medication than control group
- Assume a test p value = 0.07 and (given that threshold is < 0>
- We cannot reject the null hypothesis, and the information that p is giving us is basically that if we do this experiment many times, 95% of the times we will obtain this result that there is no difference between both conditions.
This is not what we want to know!!! This Photo by Unknown Author is licensed
under CC BY-NC-ND
Bayesian Approach
- We want to know if p (D+IBMI+) > p (D+IBMI-)
.png)
Activity 5
- Is p(BMI+|D+) the same as p(D+|BMI+)?
p (BMI+ID+) = p (D+ and BMI+) / p (D+)
p(BMI+ID+) = 0.075 / 0.1 = 0.75
p (D+I BMI+) = 0.3
Therefore, they are not the same.
Bayesian Regression
- Suppose we now want to obtain the Percentage Body Fat (PBF) of individuals, which is expensive and difficult to measure.
- Instead, we can use a Bayesian Linear Regression.
- Bayesian Linear Regression is similar to the frequentist approach, but is interpreted differently.
- i.e. provides credible intervals instead of confidence intervals.
- Credible interval: given the observed data, the effect has XX% probability of falling within this range
- Confidence interval: there is an XX% probability that when computing a confidence interval from data of this sort, the effect falls within this range
Advantages of the Bayesian Approach
- Provides a formalism to exploit all available data and knowledge about a problem
- Emphasis on continually updating ones models as data accumulate
- Provides a probability distribution instead of point estimates.
This Photo by Unknown Author is licensed under CC BY
Applications of Bayesian Inference
- SPAM Filters
- Applications in artificial intelligence andexpert systems.
- A fundamental part of computerised patter recognition techniques.
- Phyllogenetics (revolutionary relationships between species) - many demographic and evolutionary parameters to be estimated simultaneously.
- Bioinformatic and healthcare applications - Differentially gene expression analysis, single-cell classification, cancer subtyping, etc.
- Cancer risk models, called CIRI (Continuous Individualised Risk Index) - serial measurements are incorporated to update a Bayesian model which is primarily built from prior knowledge.
Comments
- A common mistake: to ignore the prior probability
- The conditional probability slides the revised probability in its direction but does not replace the prior probability
- Test sensitivity issue
- if two conditional probabilities are equal, the revised probability equals the prior probability)
- Prior distributions are chosen based on the likelihood function for each parameter.
Get your DATA 4400 Data-Driven Decision Making and Forecasting assignment solved by our Mmedical Science Experts from Exam Question Bank . Our Assignment Writing Experts are efficient to provide a fresh solution to all question. We are serving more than 10000+ Students in Australia, UK & US by helping them to score HD in their academics. Our Experts are well trained to follow all marking rubrics & referencing Style. Be it a used or new solution, the quality of the work submitted by our assignment experts remains unhampered.
You may continue to expect the same or even better quality with the used and new assignment solution files respectively. Theres one thing to be noticed that you could choose one between the two and acquire an HD either way. You could choose a new assignment solution file to get yourself an exclusive, plagiarism (with free Turn tin file), expert quality assignment or order an old solution file that was considered worthy of the highest distinction.
