"How Does Cultural Background Relate To The Nature Of Partnerships" :Research Report
- Subject Code :
ATS3725
- Country :
Australia
Introduction
In many western countries the proportion of marriage has declined, and cohabitation rates have increased. Cultural background, immigration and ethnicity can result in a significant impact on the nature of the relationships in several ways which includes communication styles, values, and norms. Immigrants are often required to abandon their old norms and values to adapt to the new values (Katz, 2001). Many of the mass international migrations of the last 100-200 years have been transitions from societies with traditional family patterns into modern or postmodern ones (Katz, 2001). Age is also a strong factor that affects partnership patterns. Younger people are more likely to engage in intimate relations other than marriage (Katz, 2001). These patterns are similar for people who had more access to educational institutions as well.
Immigrants from the former Soviet Union depicted a higher tendency to cohabitate and to legitimize cohabitation (Katz, 2001). This could be supported by two reasons. One, unlike the most modern immigration ways, these immigrants are from a more secularized and less family-oriented society in comparison to the country of their destination (Katz, 2001). Secondly, the whole immigration experience had stressful and conflicting elements, for e.g., some spouses remained in the former Soviet Union, resulting in breaking their marriage (Katz, 2001).
Marriage has decreased in Australia and across the secular West. In Australia, socio-demographic patterns in marriage and cohabitation have been varying over the years. In the late 20th century, cohabitation, divorce, and births outside marriage have increased dramatically (Heard and Dharmalingam, 2014). In the year 2011, the number of people in registered marriages (aged 15 years and above), have reduced in half (Heard and Dharmalingam, 2014). It has also been found out that divorce has stabilized, and fertility has increased in Australia. The data supports the idea that Australians are increasingly open to forming families outside of the non-traditional ways (Heard and Dharmalingam, 2014). Even though marriage has not completely disappeared, most of the Australians cohabit prior to marriage, making it most common form of partnership (Heard and Dharmalingam, 2014). The patterns have been similar in western world like the US. Even though the choices in partnerships have come with more freedom for Australians compared to older generations, factors like gender, ethnicity and socioeconomic status still play a vital role.
The research article by Hewiit and Baxter (2012) addresses some of the patterns in men and women who are married. For men who are financially independent are more likely to marry than who are less financially independent. On the other hand, women who are economical stable are less likely to get into marriage compared to rest of the women, as they are financially independent, making them less reliable on men (Hewiit and Baxter, 2012). For both genders who are religious are more likely to get into the institution of marriage than people who are less religious (Hewiit and Baxter, 2012).
Data and method
The data has been extracted using table builder pro and tables have been combined using Excel. One of the tables married and divorced rates have been combined and two other tables have been broken down according to gender.
Table 1: Ancestry Variables by the 4 Relational Variables; age (25-39)
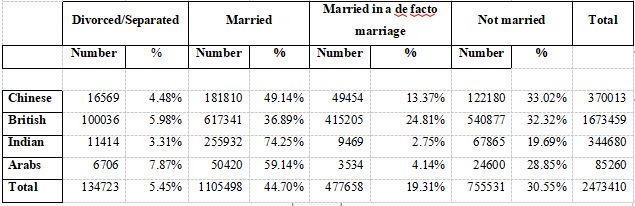
Table 1 shows the number and percentages of people from four culturally diverse groups: Chinese, British, Indian, and Arab who and their partnership types according to the 2021 Australian Census. The figures are higher for Arabs who are divorced/separated making it 7.87% of the total population whereas Indians who are divorced/separated only contributes 3.31% of the total population. Indians have higher rates in marriage, i.e., 74.25% of the total population unlike the lower rates in the divorced/separated category. On the other hand, British makes about 36.89% of the total married population. British, however, has the higher rates for married in de facto relationships, i.e., 24.81% of the total population and Indians being the lowest with. 2.75% of the total population who are in de facto marriages. Lastly, Chinese makes 33.02% of the whole population who are not married, making it the highest whereas Indians with lowest percentages i.e., 19.69% amongst the rest of the groups. Overall, the percentages are highest for people who are married for all groups, i.e., 44.70% of the whole Australian population and divorced/separated making it the lowest with 5.45%.
Table 2: Ancestry variables by the 4 Relational variables; age (25-39); Sex (Male)
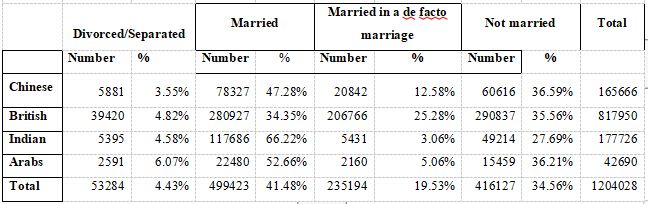
Table 2 shows the figures for only the male population of Chinese, British, Indians and Arabs in the total population of Australia. The percentages are very similar under the category of divorced/separated for British males (4.82%) and Indian males (4.58%). Arab males contribute 6.07% to the total population for this category whereas Chinese has the lowest rate which is 3.55%. Indian males have higher rates of marriage, i.e., 66.22% and British males have the lowest which is 34.35%. The percentage for British males in de facto marriages is drastically higher than other groups, i.e., 25.28% whereas Indian males have the lowest rate of 3.06% and Arab men, 5.06%. Finally, men who are not married are similar for Chinese (36.59%), British (35.56%) and Arabs (36.21%) and Indian men with lowest, 27.69%. Overall, the figure for men in these groups are higher for Married category (41.48%) and lowest for, divorced/separated category (4.43%).
Table 3: Ancestry Variables by the 4 Relational Variables; age (25-39); Sex (Female)
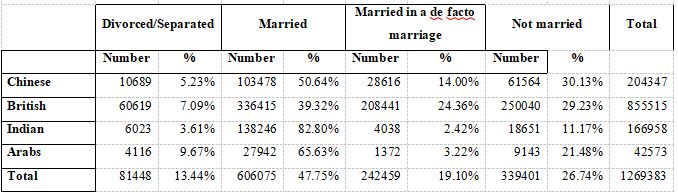
Table 3 shows the figures for only the female population of Chinese, British, Indians and Arabs in the total population of Australia. Arab females have the highest percentage for divorced/separated category whereas Indian females have the lowest, which is 3.61 %. Indian females have the proportion for marriages which is 82.80% and British has the lowest, which is 39.32%. British females have 24.36% of the population who are married in de facto marriages, but the percentages are drastically low for Indian females, i.e., 2.42%. 30.13% of Chinese females are not married and British females have similar figures too, i.e., 29.23%. Indian females have the lowest, making it 11.17% of the total. Overall, highest figures are for marriage for females and lowest for divorced/separated.
Discussion and conclusion
Driving forces of marriage, divorce and cohabitation can be affected by factors like race, and gender, social norms, and culture (Marcn, 2019). Looking at the overall data, people with Indian background despite of gender have higher rates of marriage. This could be mainly due to the existence of cultural effect (Marcn, 2019). Parents involvement in their childrens marriage financially or just in general compared to people from western cultures could be a key factor for the higher trends (Wiik, 2009). In addition to that, attitudes of Indians in Australia could be also probably because of the similarity in preferences and beliefs of their parents, family and ethnic communities and background (Marcn, 2019).
Also, it can be found out that people who are in de facto relationships is higher for British people. This could be because of the economic development and industrialization of the western worlds compared to other groups could have contributed to the rise of cohabitation. Women who are not married are lesser percentages compared to men for all groups, but they are still very close to mens figures. This could be due to the change in womens roles and wife and mother gender roles, and they are less likely to follow traditional social norms (Marcn, 2019). Also in western worlds, marriage is evolving out of existence and is replaced by cohabitation (Lewin, 2004) as it can be seen on table 1, where British have the lowest rate in marriages and highest for de facto relationships. However, overall marriage rates still are higher than defacto relationships for all groups. This could be because of the age factor as many young adults cohabit during their late teens and early 20s (Lichter & Qian, 2008).
