Internet of Things assessment
- Subject Code :
CSC8112
- Country :
United Kingdom
Assessment Overview
This assessment contributes 40% towards the total mark for this module. Out of this, 70% marks are assigned for implementation tasks and 30% marks are for the final report. It is an individual exercise: no group work is permitted for the assessment. You are advised to read and view all the instructional tutorial resources before you start implementing the solutions for the coursework Tasks 1 to 3. Each Task has been assigned a specific mark, which you will be awarded once you successfully demonstrate the completion of the same.
Once you complete Tasks 1-3, you will need to prepare the final Report (Task 4).Thiscoursework Report must be submitted onNESS by 4 pm on November 18, 2022. In this Report, you will need to provide an in-depth discussion of how you implemented the solutions (e.g., code and commands) to solve Tasks 1-3. Additionally, you will be required to demonstrate successful executions of Tasks 1-3. Before the report submission deadline, you will be provided with a 15 mins slot to conductlive demonstration. In case of unforeseen disrup- tions (e.g., further lockdowns), we may also allow recorded demonstrations.
Final marksfor this coursework will be decided by your performance in the live demonstra- tions and the technical details you will provide in the final report. While the final report needs to be submitted to NESS by 4 pm on November 18, 2022, the live demonstration session will be organised either on November 17 or 18, 2022.
You are required to complete Tasks 1-3 using the command line interface,provided by the Docker En- gine, as well as by implementing a programmatic solution in Python language.
Objectives
The learning outcomes of this coursework include the following:
- Understand how to process Internet of Things (IoT) sensor data in the edge-cloud setting?
- Be able to develop a machine learning-based IoT data processing pipeline ( data collection, data preprocessing, prediction and visualisation) in the edge-cloud setting?
- Be able to use a lightweight virtualisation technology stack, such as Docker, to implement IoT data processing pipeline in the edge-cloud setting?
A high-level picture showing the overall system design scope of the coursework is shown in Figure1, a short explanation of the components is given below:
IoT tier:
- Newcastle Urban Observatory (NCL UO)The largest set of publicly available real-time urban data in the UK. NCL UO sensors are gathering data across Newcastle With over 50 data types and counting, there are lots of live data for you to access.
Edge tier:
- Data Injector: This will be a software component that you will design and implement in Task 1, focusing on (i) reading data from Urban Observatory API and (ii) transmitting data to the machine learning
- EMQX: A broker of MQTT protocol, a message queuing system given to you as a Docker image, which forms the basis for enabling asynchronous service-to-service communication in a complex Machine Learning (ML)-based IoT data processing
- Data PreprocessingOperator: A software component that you will develop in Task 2, Responsible for preparing training data of Machine Learning
Cloud tier:
- RabbitMQ: A cloud-based message queuing
- MachineLearningModel/Classifier/Engine: A software component that can be trained to predict particular types of future
- Visualization: A component that will visualize the trend of raw time-series data and the prediction results (input from the Machine Learning Model/Classifier/Engine).
After successfully completing the coursework, you will be able to gain hands-on experience in the following interrelated technology stacks, including:
- configuring a Docker-based IoT data processing pipeline;
- pulling images from the Docker Hub (a global repository of software components images maintained by the developers);
- creating and deploying a self-contained IoT data processing service, which is often referred to as microservices
- training a machine-learning-based predictor based on real-world data streams available from Newcastle Urban Observatory;
- implementing a machine learning-based air-quality prediction micro-service;
- visualizing time-series data using
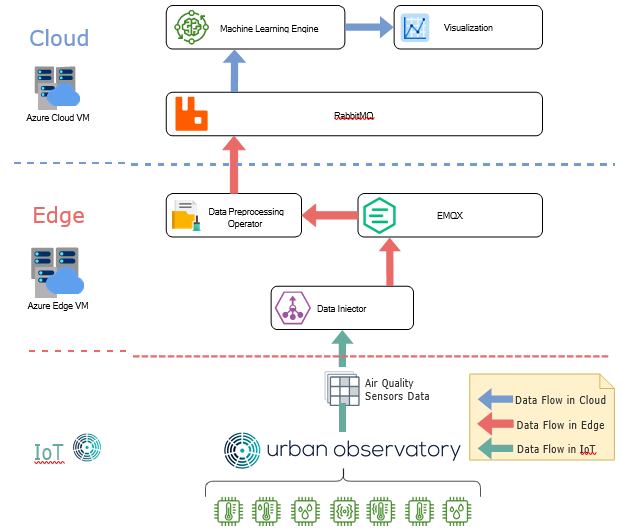
Figure 1: Overview
Pre-Requisites
Before starting the coursework, you are advised to carefully go through the training content covered in Lecture 1 and extra supplements provided in the Yuque Document (an online document platform) atTogether, these provide in-depth detail on:
- how to access and start Azure VMs, as shown in Figure2;
- how to download and run a docker image on Azure Labs;
- how to run your experiments on Azure Labs;
- some hints for system structures of every
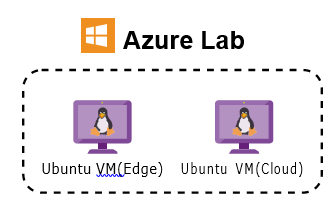
Figure 2: Relationship structure of Azure Lab and Ubuntu VMs.
Specification of Tasks
The coursework consists of 4 tasks.Please note that Tasks1-3need to be done by both the command line and implementing the logic using Python language.
Task 1: Design a data injector component by leveraging Newcastle Urban Observa- tory IoT data streams(20Marks)
Task Objectives : Understand and learn how to pull and run a Docker image from Docker Hub using the command line interface, how to collect real-world IoT data streams by invoking the Application Programming Interface (API) of Newcastle Urban Observatory, how to save data into the EMQX (a scalable MQTT broker for IoT applications), and how to re-compile and build Docker image using the command line and programmatic interfaces.
- Pull and run the Docker image "emqx/emqx" from Docker Hub in the virtual machine run- ning on Azure lab (Edge). Perform this task first using the command line interface (CLI).
- Develop a data injector component with the following functions (Code) in Azure Lab (Edge) or the Azure Lab localhost:
- Collect data from Urban Observatory platform by sending HTTP request to the follow- ing url . Following that, please print out the raw data streams that you collected on the
- Although the raw air quality data you collected from the Urban Observatory API contains many metrics includingNO2, NO,CO2, PM2.5, and PM10, among others, for the purpose of this coursework you only need to store and analyze PM2.5 data. While many meta-data are available for PM2.5 data, such as sensor name, timestamp, value, and location, you only need to store the metrics related to the Timestamp and Value meta-data
- Send all 5 data to be used by Task 2.2 (a) to EMQX service of Azure lab (Edge).
Task 2: Data preprocessing operator design (30 Marks)
Task Objectives: Understand how to clean and prepare data for machine learning training by applying data processing operations, such as outliers cleaning and data reformatting. Moreover, you will also learn how to collect/send data from/to message queuing systems (e.g., EMQX and RabbitMQ), which are central to IoT data stream management. This task will also help you understand how nativeDocker Compose techniquescan be leveraged to manage and deploy a complex IoT application stack/pipeline.
- Define aDocker compose filewhich contains the following necessary configurations and instructions for deploying and instantiating the following set of Docker images (as shown in Figure 1) on Azure lab (Cloud):
- Download and run RabbitMQ image (rabbitmq:management);
- Design a data preprocessing operator with the following functions (code) inAzure Lab (Edge):
- Collect all 5 data published by Task 1.2 (c) from EMQX service, and please print out the PM2.5 data to the console (this operator will run as a Docker container, so the logs can be seen in the docker logs console automatically).
- Filter out outliers (the value greater than 50), and please print out outliers to the console (docker logs console).
- Since the original PM2.5 data readings are collected every 15 mins, so please imple- ment a python code to calculate the averaging value of PM2.5 data on daily basis (every 24 hours) and please print out the result to the console (docker logs console).
- Transfer all results (averaged PM2.5 data) to be used by Task 3.2 (a) into RabbitMQ service onAzure lab (Cloud).
- Define a Dockerfile to migrate your "data preprocessing operator" source code into a Docker image and then modify thedocker-compose fileto run it as a container locally on the Azure lab (Edge).
Task 3: Time-series data prediction and visualization (20 Marks)
Task Objectives: Understand how to use a machine learning model/classifier with time- series sensor data, that you prepared in Task 2, to make a prediction, and how to visualize those data and predicted results.
- Download a pre-defined Machine Learning (ML) engine code
- Design a 5 prediction operator with the following functions (code) in Azure Lab (Cloud) or the Azure Lab localhost:
- Collect all averaged daily PM2.5 data computed by Task 2.2 (d) from RabbitMQ service, and please print out them to the
- Convert timestamp to date time format ( year-month-day hour:minute:second), and please print out the 5 data with the reformatted timestamp to the console.
- Use the line chart component of matplotlib to visualize averaged PM2.5 daily data, directly display the figure or save it as a
- Feed averaged 5 data to machine learning model to predict the trend of PM2.5 for the next 15 days (this predicted time period is a default setting of provided machine learning predictor/classifier model).
- Visualize predicted results from Machine Learning predictor/classifier model, directly display the figure or save as it a file (pre-defined in the provided Machine Learning code).
Task 4: Report (30 Marks)
Prepare the Final Report in plain English. There is no word or page limit, however, we appreciate a clear, concise and focussed presentation style. The report should consist of:
- Detailed response to each task and related sub-tasks.
- Screenshots of running services in the Docker
- Screenshots of Code Snippets and/or Docker
- Plots of data and prediction results by using matplotib
- Analytical discussion of the results and related conclusions
