Introduction To System Dynamics Assignment
- Country :
United States
A. Identifying Stock and Flow Variables
The distinction between stocks and flows is crucial for understanding the source of dynamics. In physical systems it is usually obvious which variables are stocks and which are flows. In human and social systems, often characterized by intangible, soft variables, identification may be more difficult.
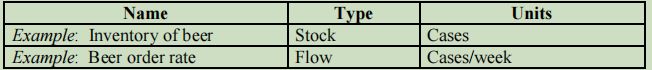
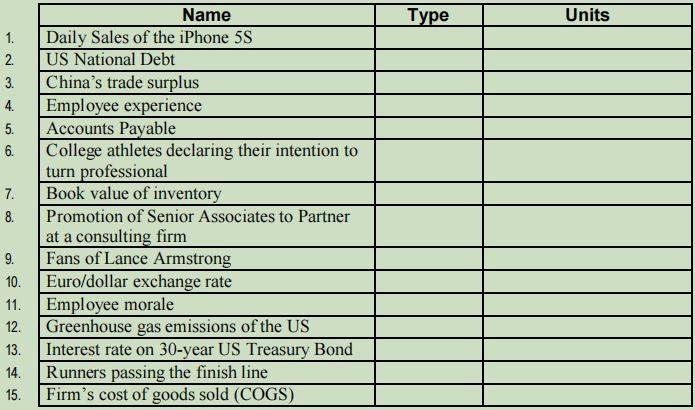
A1. For each of the following variables, state whether it is a stock or a flow, and give units of measure for each.
B. Mapping Stock and Flow Networks
Systems are composed of interconnected networks of stocks and flows. Modelers must be able to represent the stock and flow networks of people, material, goods, money, energy, etc. from which systems are built.
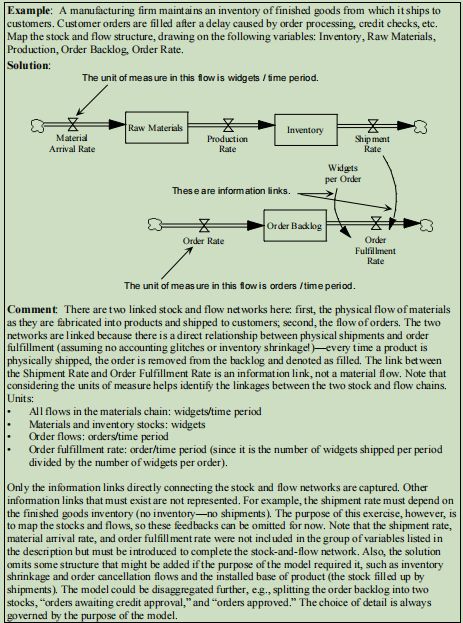
For each of the following cases, construct a stock and flow diagram that properly maps the stock and flow networks described.
- Not all the variables are connected by physical flows; they may be linked by information flows, as in the example below.
- You may need to add additional stocks or flows beyond those specified to complete your diagram (but keep it simple). Be sure to consider the boundary of your stock and flow map. That is, what are the sources and sinks for the stock and flow networks? Are you tracking sources and sinks far enough upstream and downstream? This process of deciding how far to extend the stock and flow network is called challenging the clouds because you question whether the clouds are in fact unlimited sources or sinks.
- Consider the units of measure for your variables and make sure they are consistent within each stock and flow chain.
B1. Firms often have great difficulty bringing new products to market on time and with the quality and functionality customers demand. Map the stocks and flows of the new product development process for a typical high-tech firm. Product development includes the following stages: concept generation, detailed design, prototyping, testing, and launch. At each stage, projects are evaluated, with some continuing on and the rest cancelled.
Dont forget to challenge the clouds in this example. What happens after new products are launched? How long do new products remain on the market?
B2. A computer manufacturer maintains a large call center operation to handle customer inquiries. Customers with questions or problems call a toll free number for help. In this firm, incoming calls are answered by a voice recognition system that routes calls to an automated system or, if the customer elects, to a live customer service representative (CSR). Calls default to the automated system but customers can, at any time, press 0 or say representative to speak to a CSR, or, of course, hang up. Callers electing to speak to a CSR may be placed on hold until an agent becomes available. If the call is answered before the customer gets frustrated and hangs up, the CSR may be able to resolve the issue. Often, however, the CSR is unable to solve the problem and forwards the call to a supervisor or specialized department such as technical support. The issue may or may not be resolved by these specialists. Map the stock and flow structure of calls as they flow through the system.
In reality, customer inquiries arrive by phone, by email, and by live chat from the firms website. You dont need to consider these channels separately. Likewise, do not attempt to separate inbound calls into different categories such as billing problems or tech support questions. Assume there is a single flow of calls coming in to the system. These calls are then divided into those electing the automated system and those electing to speak to an agent.
C. Dynamics of Accumulation
Stocks are accumulations. The difference between the inflows and outflows of a stock accumulates, altering the level of the stock variable. The process of accumulation gives stocks inertia and memory and creates delays. Since realistic models are far too complex to solve with formal analysis, it is important to understand the relationship between flows and the behavior of stocks intuitively.
- The goal is to develop your intuition about stocks and flows. Be sure to read Chapter 7 first. Consider the following system:
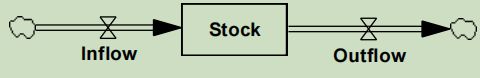
C1. The top graph below shows the behavior of the two flows, or rates: the inflow (the solid line) and outflow (dashed line) for the stock. On the graph provided below, draw the trajectory of the stock given the inflow and outflow rates shown. Indicate the numerical values for any maxima or minima, and for the maximum or minimum values of the slope for the stock. Assume the initial quantity in the stock is 100 units.
D. Modeling Goal-Seeking Processes
All goal-seeking processes consist of balancing (negative) feedback loops. In a balancing loop, the system state is compared to a goal, and the gap or discrepancy is assessed. Corrective actions respond to the sign and magnitude of the gap, bringing the state of the system in line with the goal.
For example, consider programs designed to improve the quality of a process in a company. The process could be in manufacturing, administration, product development-any activity within the organization. Improvement activity is iterative. Members of an improvement team identify sources of defects in a process, often ranking benefits of correcting them using a Pareto chart.
They then design ways to eliminate the source of the defect, and try experiments until a solution is found. They then move on to the next most critical source of defects. Quality professionals refer to this iterative cycle as the PlanDoCheckAct or PDCA cycle (also known as the Deming cycle, for the late quality guru W. Edwards Deming). In the PDCA process, the improvement team: (1) plans an experiment to test an improvement idea, (2) does the experiment, (3) checks to see if it works, then (4) actseither planning a new experiment if the first one failed or implementing the solution and then planning new experiments to eliminate other sources of defects. The team continues to cycle around the PDCA loop, successively addressing and correcting root causes of defects in the process. This learning loop is not unique to TQM: All learning and improvement programs, including Six Sigma, follow an iterative process similar to the PDCA cycle.
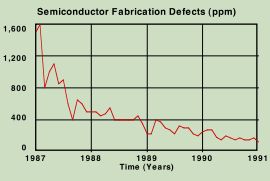
The figure below shows data on defects from the wafer fabrication process of a mid-size semiconductor firm (from Figure 4-5 in Business Dynamics). The firm began its TQM program in 1987, when defects were running at a rate of roughly 1500 parts per million (ppm). After the implementation of TQM, the defect rate fell dramatically, until by 1991 defects seem to reach a new equilibrium close to 150 ppma spectacular factor-of-ten improvement. Note that the decline is rapid at first, then slows as the number of defects falls.
D1. Create a model of the improvement process described above and compare its behavior to the data for the semiconductor firm. Once you have formulated your model, make sure file (.mdl file).
Follow the instructions below precisely. Do not add structure beyond that specified.
- The state of the system is the defect rate, measured in ppm. The defect rate in 1987 was 1500 ppm.
The defect rate is not a rate of flow, but a stock characterizing the state of the systemin this case, the ratio of the number of defective dies to the number produced. - The defect rate decreases when the improvement team identifies and eliminates a root cause of defects. Denote this outflow the Defect Elimination Rate.
- The rate of defect elimination depends on the number of defects that can be eliminated by application of the improvement process and the average time required to eliminate defects.
- The number of defects that can be eliminated is the difference between the current defect rate and the theoretical minimum defect rate. The theoretical minimum rate of defect generation varies with the process you are modeling and how you define defect. For many processes, the theoretical minimum is zero (for example, the theoretical minimum rate of late deliveries is zero). For other processes, the theoretical minimum is greater than zero (for example, even under the best imaginable circumstances, the time required to build a house or the cycle time for semiconductor fabrication will be greater than zero). In this case, assume the theoretical minimum defect level is zero.
- The average time required to eliminate defects for this process in this company is estimated to be about 0.75 years (9 months). The average improvement time is a function of how much improvement can be achieved on average on each iteration of the PDCA cycle, and by the PDCA cycle time. The more improvement achieved each cycle, and the more cycles carried out each year, the shorter the average time required to eliminate defects will be. These parameters are determined by the complexity of the process and the time required to design and carry out experiments. In a semiconductor fab, the processes are moderately complex and the time required to run experiments is determined by the time needed to run a wafer through the fabrication process and analyze the results. Data collected by the firm prior to the start of the TQM program suggested the 9 month time was reasonable.
- Equipment wear, changes in equipment, turnover of employees, and changes in the product mix can introduce new sources of defects. The defect introduction rate is estimated to be constant at 250 ppm per year.
D2. Run your model with the base case parameters, and hand in the plot.
- Briefly describe the models behavior.
- How well does your simulation match the historical data? Are the differences likely to be important if your goal is to understand the dynamics of process improvement and to design effective improvement programs?
- Does the stock of defects reach equilibrium after 9 months (the average defect elimination time)? Referring to the structures in your model, explain why or why not.
D3. Experiment with different values for the average defect elimination time. What role does the defect elimination time play in influencing the behavior of other variables?
D4. The stock reaches equilibrium when its inflows equal its outflows. Set up that equation and solve for the equilibrium defect rate in terms of the other parameters.
- What determines the equilibrium (final) level of defects? Why?
- Does the equilibrium defect rate depend on the average time required to eliminate defects? Why/Why not?
D5. Explore the sensitivity of your models results to the choice of the time step or dt (for delta time).
Before answering this question, read Appendix A in Business Dynamics.
- Change the time step for your model from 0.125 years to 0.0625 years. Do you see a substantial difference in the behavior?
- What happens when dt equals 0.5 years? Why does the model behave as it does?
- What happens when dt equals 1 year? Why does the simulation behave this way?
Are you struggling to keep up with the demands of your academic journey? Don't worry, we've got your back! Exam Question Bank is your trusted partner in achieving academic excellence for all kind of technical and non-technical subjects.
Our comprehensive range of academic services is designed to cater to students at every level. Whether you're a high school student, a college undergraduate, or pursuing advanced studies, we have the expertise and resources to support you.
To connect with expert and ask your query click here Exam Question Bank
