Logistic Regression Model Assessment
- Country :
Australia
1. Match the statements below with the corresponding terms from the list.
- multicollinearity
- extrapolation
- adjusted R2
- quadratic regression
- interaction
- residual plots
- fitted equation
- dummy variables
- cause and effect
- multiple regression model
- R2
- residual
- influential points
- outliers
____ Used when a numerical predictor has a curvilinear relationship with the response.
____ Worst kind of outlier, can totally reverse the direction of association between x and y.
____ Used to check the assumptions of the regression model.
____ Used when trying to decide between two models with different numbers of predictors.
____ Used when the effect of a predictor on the response depends on other predictors.
____ Proportion of the variability in y explained by the regression model.
____ Is the observed value of y minus the predicted value of y for the observed x..
____ A point that lies far away from the rest.
____ Can give bad predictions if the conditions do not hold outside the observed range of x's.
____ Can be erroneously assumed in an observational study.
____ = 0 + 11 + 22 + ? + + ~2)
____= 0 + 11 + 22 + ? + ____ Problem that can occur when the information provided by several predictors overlaps.
____ Used in a regression model to represent categorical variables.
Answer:
d m f c e k l n b I j g a h
2. For each of the following situations, specify whether the statement provided is always true, could be true for some populations and/or samples, or is never true. (Circle your answer.)
- When X and Y have a deterministic linear relationship, the slope of the line is 1.
Always true Could be true Never true - If 100 independent 95% confidence intervals are created for a mean, each based on a different sample, exactly 95 of them will cover the true population mean.
Always true Could be true Never true - Consider a regression situation with Y as the response, and 2 possible predictors X1 and X2. SSTotal will be the same for the model with X1 and X2 as predictors as it is for the model with only X1 as a predictor.
Always true Could be true Never true - When the slope of a regression line is negative, 2 will also be negative.
Always true Could be true Never true - When the correlation between X and Y is positive (and not 0) the slope of the least square regression line for simple linear regression is also positive.
Always true Could be true Never true - In a simple linear regression setting the numerical values of 1 and
?1 are equal.
Always true Could be true Never true - The sum of the residuals from fitting a least squares regression line will be 0.
Always true Could be true Never true
3. In a linear regression situation with response variable Y and one or more X explanatory variables, specify whether each of the following involves the Y values only, the X values only, or both the Y and the X values. (Circle your answer).
- Variance inflation factor Ys only Xs only Ys and Xs
- Hat values Ys only Xs only Ys and Xs
- SSTotal Ys only Xs only Ys and Xs
- Cooks Distance values Ys only Xs only Ys and Xs
- Predicted values (y) Ys only Xs only Ys and Xs
The board of directors of a professional association conducted a random sample survey of 30 members to assess the effects of several possible amounts of dues increase. Let X denotes the dollar increase in annual dues and Y = 1 if the individual surveyed indicated that the membership will not be renewed at that amount of dues increase and 0 if the membership will be renewed.
model <- glm(y ~ x, family = binomial(link = "logit")) summary(model)
$coefficients
Estimate Std. Error z value Pr(>|z|)
(Intercept) -4.8075139 2.65575944 -1.810222 0.07026138
x 0.1250783 0.06675808 1.873605 0.06098494
- Obtain exp(b1) and interpret it.
- What is the estimated probability that association members will not renew their membership if the dues are increased by $40?
- Estimate the amount of dues increase for which 75% of the members are expected not to renew their association membership.
5. A local health clinic sent fliers to its clients to encourage everyone, but especially older persons at high risk of complications, to get a flu shot in time for protection against an expected flu epidemic. In a pilot follow-up study, 159 clients were randomly selected and asked whether they actually received a flu shot. A client who received a flu shot was coded Y=1, and a client who did not receive a flu shot was coded Y=0. In addition, data were collected on their age (X1) and their health awareness. The latter data were combined into a heal awareness index (X2), for which higher values indicate greater awareness. Also included in the data was client gender, where males were coded X3=1 and females were coded X3=0.
Model2 <- glm(y ~ x1+x2+x3, family = binomial(link = "logit")) Summary(Model2)
Estimate Std. Error z value Pr(>|z|)
(Intercept) -1.17715922 2.98242265 -0.3946990 0.693065046
x1 0.07278802 0.03038087 2.3958501 0.016581871
x2 -0.09898649 0.03347856 -2.9567130 0.003109374
x3 0.43397485 0.52179407 0.8316976 0.405579681
- Obtain exp(b1), exp(b2), and exp(b3). Interpret these numbers
- What is the effect of 5 years age difference on the odds of getting a flu shot?
- What is the estimated probability that male clients aged 55 with a health awareness index of 60 will receive a flu shot?
- What is the estimated probability that female clients aged 55 with a health awareness index of 60 will receive a flu shot?
- Is Age significant? Carry out the test. State the hypothesis, state the p-value and state your conclusions in context.
6. The Space Shuttle Challenger disaster occurred on January 28, 1986, when the NASA space shuttle orbiter Challenger broke apart 73 seconds into its flight, leading to the deaths of its seven crew members. Disintegration of the vehicle began after an O-Ring seal in its right solid rocket booster failed at liftoff. O-Ring seal failed because the launch temperature is lower than expected. Therefore, it is critical to carefully test the reliability of O-Ring under different circumstance. Here we have 24 data points, including the launching temperature and whether at least one O-Ring failure has occurred. The temperature (?F) at the time of the flight and whether at least one of the six primary O rings suffered thermal distress (1 = yes, 0 = no). Sample data is Given below:
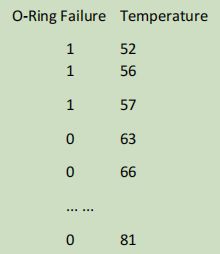
# fit the logistic regression model
fit <- glm(oring ~ temperature, family=binomial) summary(fit)
# R output
Coefficients:
Estimate Std. Error z value Pr(>|z|)
(Intercept) 10.87535 5.70291 1.907 0.0565 .
temperature -0.17132 0.08344 -2.053 0.0400 *
- For the logistic regression model using temperature as a predictor for the probability of thermal distress, calculate the estimated probability of thermal distress at 31? , the temperature at the time of the Challenger flight.
- At the temperature at which the estimated probability equals 0.5, give a linear approximation for the change in the estimated probability per degree increase in temperature.
- Interpret the estimated effect of temperature on the odds of thermal distress.
7. Let denote the probability that a randomly selected respondent supports current laws legalizing abortion, predicted using gender of respondent (G = 0,male; G = 1, female), religious affiliation (R1 = 1, Protestant, 0 otherwise;R2 = 1, Catholic, 0 otherwise; R1 = R2 = 0, Jewish), and political party affiliation (P1 = 1, Democrat, 0 otherwise; P2 = 1, Republican, 0 otherwise, P1 = P2 = 0, Independent). The logit model with main effects has prediction equation
logit(y)= .11 + .16G ? .57R1 ? .66R2 + .47P1 ? 1.67P2
Interpret each of the coefficients.
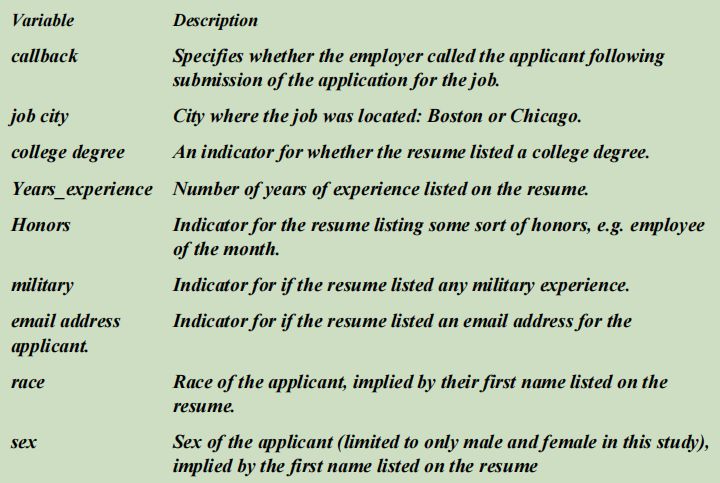
We will consider experiment data from a study that sought to understand the effect of race and sex on job application callback rates. To evaluate which factors were important, job postings were identified in Boston and Chicago for the study, and researchers created many fake resumes to send off to these jobs to see which would elicit a callback. The researchers enumerated important characteristics, such as years of experience and education details, and they used these characteristics to randomly generate the resumes. Finally, they randomly assigned a name to each resume, where the name would imply the applicants sex and race.
The response variable of interest is whether or not there was a callback from the employer for the applicant, and there were 8 attributes that were randomly assigned that well consider, with special interest in the race and sex variables. Race and sex are protected classes in the United States, meaning they are not legally permitted factors for hiring or employment decisions.
Model 1:
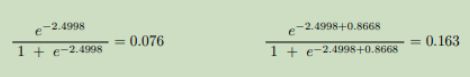
We start by fitting a model with a single predictor: honors. This variable indicates whether the applicant had any type of honors listed on their resume, such as employee of the month. The following logistic regression model was fit using statistical software:
logit(p) = log ( pi/1-pi) = ?2.4998 + 0.8668 ? ?
- If a resume is randomly selected from the study and it does not have any honors listed, what is the probability resulted in a callback?
- What would the probability be if the resume did list some honors?
Model 2:
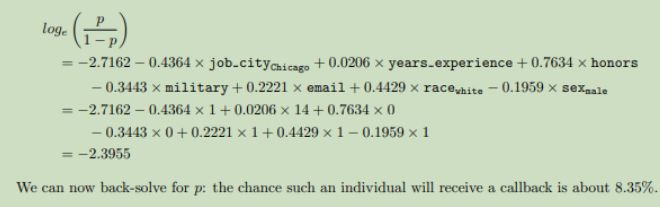
We used statistical software to fit the logistic regression model with important/significant predictors described above
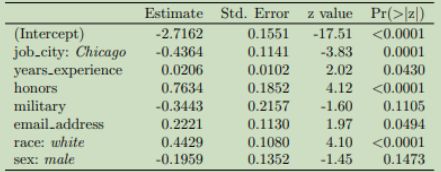
Use the model summarized in above to estimate the probability of receiving a callback for a job in Chicago where the candidate lists 14 years experience, no honors, no military experience, includes an email address, and has a first name that implies they are a White male.
Are you struggling to keep up with the demands of your academic journey? Don't worry, we've got your back! Exam Question Bank is your trusted partner in achieving academic excellence for all kind of technical and non-technical subjects.
Our comprehensive range of academic services is designed to cater to students at every level. Whether you're a high school student, a college undergraduate, or pursuing advanced studies, we have the expertise and resources to support you.
To connect with expert and ask your query click here Exam Question Bank
