SEB113 Practical Worksheet 9 Solutions Assessment
- Subject Code :
SEB113
- Country :
Australia
Question 1: One-way ANOVA
a. A researcher is comparing the relative usefulness of four different brands of batteries. To test the lifetime of each battery, a battery is placed into a torch that is turned on and the time for the light to fail is measured in hours. This is repeated three times for each brand of batteries. The measurements, including the mean and standard deviation, are given in the table below.
| Brand | Life | Mean | Standard deviation |
|---|---|---|---|
| A | 24.2 31.7 28.9 | 28.3 | 3.79 |
| B | 31.7 33.6 32.8 | 32.7 | 0.95 |
| C | 41.3 45.6 61.2 | 49.4 | 10.47 |
| D | 31.9 38.2 46.2 | 38.8 | 7.17 |
The results of a one-way ANOVA at a significance level of are shown in the table below
| Source of variation | Sum of squares | Degrees of freedom | Mean squares |
|---|---|---|---|
| Between groups | 751.5 | 3 | 250.51 |
| Within groups | 352.6 | 8 | 44.07 |
| Total | 1104.1 | 11 |
- State the null and proposed hypothesis for the one-way ANOVA.
Proposed Hypothesis: There is a significant difference between the mean lifetime of batteries across the four brands.
Null Hypothesis: There is not a significant difference between the mean lifetime of batteries across the four brands. - Calculate the test statistic for the one-way ANOVA.
Test statistic is denoted by FSTAT,
Mean of squares between groups is 250.51
Mean of squares within groups is 44.07
FSTAT = Msb/Wsb= 250.51/ 44.07 = 5.68 - Using the value of the test statistic from (ii) make a decision on the hypothesis test.
Test statistic, FSTAT = 5.68
From table on page 6 in resource sheet
Critical value, FCRIT = Ftails, significance, df1, df2 = F 1,0.05, 3, 8 = 4.02
Because FSTAT > FCRIT (5.68 > 4.02) we reject the null hypothesis andaccept the proposed hypothesis.
Therefore there is a statistically significant difference between the batteries mean lifetime.
(b) A medical company conducts a clinical trial to assess the effectiveness of two drugs. Twelve individuals participate in the trial and are divided into three treatment groups: Drug A, Drug B, Placebo. To measure the effectiveness of the drug the time taken to observe an effect is measured in minutes, referred to as the reaction time. The measurements, including the mean and standard deviation, are given in the table below.
| Treatment | Reaction time | Mean | Standard deviation |
|---|---|---|---|
| Drug A | 22.3 26.0 25.2 28.9 | 25.6 | 2.71 |
| Drug B | 20.2 22.5 21.6 25.7 | 22.5 | 2.33 |
| Placebo | 28.9 29.1 27.3 35.7 | 30.2 | 3.72 |
The results of a one-way ANOVA at a significance level of are shown in the table below.
- State the null and proposed hypothesis for the one-way ANOVA.
Proposed Hypothesis: There is a significant difference between the mean reaction times across the three treatment groups.
Null Hypothesis: There is not a significant difference between the mean reaction times across the three treatment groups. - Calculate the test statistic for the one-way ANOVA.
Test statistic is denoted by FSTAT,
Mean of squares between groups is 60.86
Mean of squares within groups is 8.89
FSTAT = Msb/Wsb= 60.86 /8.89 = 6.85 - Using the value of the test statistic from (ii) make a decision on the hypothesis test.
Test statistic, FSTAT = 6.85
From table on page 6 in resource sheet
Critical value, FCRIT = Ftails, significance, df1, df2 = F 1,0.05, 2, 9 = 4.26
Because FSTAT > FCRIT (6.85 > 4.26) we reject the null hypothesis and accept the proposed hypothesis.
Therefore there is a statistically significant difference between the groups mean reaction rates.
(c) An agricultural scientist is comparing four different fertilizers to determine which fertilizer will produce the best yield for potatoes. The same variety of potatoes were grown in twelve different randomly selected plots. Measurements of the yield, including the mean and standard deviation, are given in the table below.
| Fertilizer | Yield | Mean | Standard deviation |
|---|---|---|---|
| A | 11.0 13.3 15.0 | 13.1 | 2.0 |
| B | 8.6 9.9 12.2 | 10.2 | 1.82 |
| C | 8.2 11.1 15.6 | 11.6 | 3.73 |
| D | 13.2 15.3 18.6 | 15.7 | 2.72 |
The results of a one-way ANOVA at a significance level of are shown in the table below.
| Source of variation | Sum of squares | Degrees of freedom | Mean squares |
|---|---|---|---|
| Between groups | 49.13 | 3 | 16.378 |
| Within groups | 57.33 | 8 | 7.167 |
| Total | 106.46 | 11 |
- State the null and proposed hypothesis for the one-way ANOVA.
Proposed Hypothesis: There is a significant difference between the mean yields across the fertilizer types.
Null Hypothesis: There is not a significant difference between the mean yields across the fertilizer types. - Calculate the test statistic for the one-way ANOVA.
Test statistic is denoted by FSTAT,
Mean of squares between groups is 16.378
Mean of squares within groups is 7.167
FSTAT =Msb/Wsb = 16.378/ 7.167 = 2.29 - Using the value of the test statistic from (ii) make a decision on the hypothesis test.
Test statistic, FSTAT = 2.29
From table on page 6 in resource sheet
Critical value, FCRIT = Ftails, significance, df1, df2 = F 1,0.05, 3, 8 = 4.07
Because FSTAT < FCRIT> Therefore we are unable to detect a statistically significant difference between the fertiliser types mean yield.
(d)The performance of three different types of petrol was tested on nine different cars. Each car was given a tankful of petrol and was driven on the same route at the same speed until the tank was empty. Measurements of the total distance travelled (km), including the mean and standard deviation, are given in the table below.
| Petrol | Distance travelled | Mean | Standard deviation |
|---|---|---|---|
| A | 476 506 494 | 492.0 | 15.1 |
| B | 520 512 509 | 513.7 | 5.7 |
| C | 510 502 517 | 509.7 | 7.5 |
The results of a one-way ANOVA at a significance level of are shown in the table below.
| Source of variation | Sum of squares | Degrees of freedom | Mean squares |
|---|---|---|---|
| Between groups | 797.6 | 2 | 398.8 |
| Within groups | 633.3 | 6 | 105.6 |
| Total | 1430.9 | 8 |
- State the null and proposed hypothesis for the one-way ANOVA.
- Calculate the test statistic for the one-way ANOVA.
- Using the value of the test statistic from (ii) make a decision on the hypothesis test.
(e) The trial in Q1(b) is expanded to include sixty participants. The participants are divided into three equally sized treatment groups. We will now perform a one-way ANOVA, with a significance level of , using R.
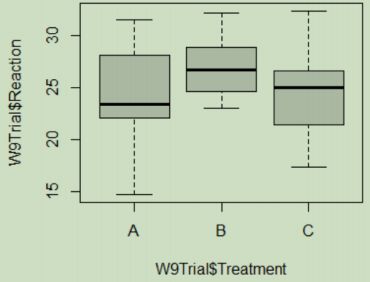
- Using the box plot, what do you expect the result of the one-way ANOVA on this data will be? If you expect that there will be a significant difference between some, or all, of the sample mean values, for which pairs of brands do you expect the means will be significantly different?
I would not expect there to be a significant difference between means.
- Perform a one-way ANOVA by entering the following commands into the R file (top left panel) and then click Run. summary(aov(W9Trial$Reaction ~ W9Trial$Treatment, data= W9Trial))
Df Sum Sq Mean Sq F value Pr(>F)
W9Trial$Treatment 2 90.9 45.45 2.802 0.069 .
Residuals 57 924.5 16.22
---
Signif. codes: 0 *** 0.001 ** 0.01 * 0.05 . 0.1 1 - State the conclusion to the hypothesis test by interpreting the R output.
The p-value = 0.069, which is greater than the significance level of 0.05 so fail to reject the null hypothesis and fail to accept the proposed hypothesis.
Therefore, we are unable to detect a significant difference between the groups mean reaction rates. - If the one-way ANOVA shows that there is a difference, investigate where the significant difference(s) exist using a Tukey post hoc test. Enter the following commands into the R file (top left panel), click Run, and then interpret the output.
TukeyHSD(aov(W9Trial$Reaction ~ W9Trial$Treatment, data= W9Trial))
No difference detected.
(f) The experiment in Q1(a) is repeated with twenty measurements for each brand of battery. To perform a oneway ANOVA, with a significance level of , for this data we will use R.
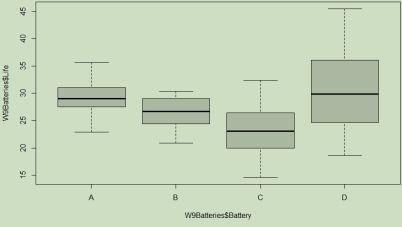
- Using the box plot, what do you expect the result of the one-way ANOVA on this data will be? If you expect that there will be a significant difference between some (or all) of the sample mean values, for which pairs of brands do you expect the means will be significantly different?
I would expect there to be a detectable difference. I would expect this difference to be between group A and C, and C and D, also possible B and C but this seems less likely.
- Perform a one-way ANOVA by entering the following commands into the R file (top left panel) and then click Run.
summary(aov(W9Batteries$Life ~ W9Batteries$Battery,data=W9Batteries))
Df Sum Sq Mean Sq F value Pr(>F)
W9Batteries$Battery 3 627.4 209.15 8.792 4.47e-05 ***
Residuals 76 1807.9 23.79
---
Signif. codes: 0 *** 0.001 ** 0.01 * 0.05 . 0.1 1 - State the conclusion to the hypothesis test by interpreting the R output.
The p-value = 4.47e-05, which is less than the significance level of 0.05 so reject the null hypothesis and accept the proposed hypothesis.
Therefore, we are able to detect a significant difference between the groups mean reaction rates. - If the one-way ANOVA shows that there is a difference, investigate where the significant difference(s) exist using a Tukey post hoc test. Enter the following commands into the R file (top left panel), click Run, and then interpret the output.
TukeyHSD(aov(W9Batteries$Life ~ W9Batteries$Brand,data=W9Batteries))
Tukey multiple comparisons of means
95?mily-wise confidence level
Fit: aov(formula = W9Batteries$Life ~ W9Batteries$Battery, data = W9Batteries)
$`W9Batteries$Battery`
diff lwr upr p adj
B-A -3.075 -7.126451 0.976451 0.1994269
C-A -6.600 -10.651451 -2.548549 0.0003104
D-A 0.345 -3.706451 4.396451 0.9960188
C-B -3.525 -7.576451 0.526451 0.1104994
D-B 3.420 -0.631451 7.471451 0.1277731
D-C 6.945 2.893549 10.996451 0.0001379
From this output we can determine that the differences between group C and A
are statistically significant because the p-value = 0.0003104 which is less than the significance level of 0.05.
We can also determine that the differences between group D and C are statistically significant because the p-value = 0.0001379 which is less than the significance level of 0.05.
(g) In Week 5 you generated a file called "23se1surveydatatop50.xlsx". This file contained fifty randomly selected rows of results from the Statistics Portfolio Survey. If you have not yet generated this file there is a stepby-step instructional video on how to create this file on the SEB113 Canvas Week 5 Module. We will now explore this data set using a one-way ANOVA.
- Choose a Qualitative (Categorical) variable and a Quantitative - Continuous variable in the data set to analyse, for example "Travel_Type" and "Travel_Time". A full list of variables in the Statistics Portfolio Survey results, and their descriptions, is appended to this document. If you are unsure if your choices of variables are appropriate, ask your tutor in your workshop.
- State a question that you can explore with a one-way ANOVA. If you are unsure if your question is appropriate, ask your tutor in your workshop.
- State the null and proposed hypothesis for your question.
- Using R perform a one-way ANOVA, state the p-value associated with your hypothesis test, and state the conclusion to your hypothesis test.
- If the one-way ANOVA shows that there is a difference, investigate and state where the significant difference(s) exist using a Tukey post hoc test.
Hint: Question 1(e) and 1(f) are similar
Question 2: Two-way ANOVA
(a) [Challenge] A researcher is comparing the relative usefulness of two different brands of batteries using two different torches. To assess the lifetime of each battery, a battery is placed into one of the torches which is then turned on and the time taken for the light to fail is measured in hours. The measurements, including the mean and standard deviation, are given in the table below.
Mean
| Brand | Torch A | Torch B | |
|---|---|---|---|
| A | 21.40 | 29.10 | 25.25 |
| B | 24.90 | 31.70 | 28.30 |
| Mean | 23.15 | 30.40 |
The results of a two-way ANOVA at a significance level of are shown in the table below.
| Source of variation | Sum of squares | Degrees of freedom | Mean squares |
|---|---|---|---|
| Brand | 9.30 | 1 | 9.30 |
| Torch | 52.56 | 1 | 52.56 |
| Error | 0.20 | 1 | 0.20 |
| Total | 80.38 | 3 |
- State the null and proposed hypothesis for the two-way ANOVA.
Proposed Hypothesis: There is a significant difference in the mean lifetime of the batteries due to battery brand or torch used.
Null Hypothesis: There is no significant difference in the mean lifetime of the batteries due to battery brand or torch used. - Calculate the test statistic for the two-way ANOVA.
Test statistics are denoted by F,
Mean of squares of Brand Battery is 9.30
Mean of squares of Torch is 52.56
Mean of squares of the Error is 0.20
FBattery =Msbattery/Mserror = 9.30/ 0.20 = 46.5
FTorch = Mstorch/Mserror= 52.56/ 0.20 = 262.8 - Using the value of the test statistic from (ii) make a decision on the hypothesis test.
Test statistics, FBattery = 46.5 and FTorch = 262.8
From table on page 6 in resource sheet
Critical value, FCRIT = Ftails, significance, df1, df2 = F 1,0.05, 1, 1 = 161
FBattery < FCRIT> FCRIT (262.8 > 161).
Therefore, only the Torch has a significant effect on the lifetime of the batteries.
