SIT220/731 Data Wrangling Assignment
- Subject Code :
SIT220-731
- Country :
Australia
1 Introduction
This task is related to Module 4 (see the Learning Resources on the unit site; see also Chapters 10, 11, 12, 16 of our book).
Ideally, you should complete this task by the end of Week 8. It is due on Week 11 (Friday). Start tackling this task as early as possible. If we find your first solution incomplete or otherwise incorrect, you will still be able to amend it based on the generous feedback we will give you (allow 35 working days). In case of any problems/questions, do hot hesitate to attend our on-campus/online classes or use the Discussion Board on the unit site. Submitting after the aforementioned due date might incur a late penalty. The cut-off date is Week 12 (Friday). There will be no extensions (this is a Week 8 task, after all) and no solutions will be accepted thereafter. At that time, if your submission is not 100% complete, it will be marked as FAIL, without the possibility of correcting and resubmitting. This task is part of the hurdle requirements in this unit. Not submitting the correct version on time results in failing the unit.
A good data engineer must have fine time management skills. To ensure a fair environment for all, we are always very strict about deadlines. Luckily, most students know how to do the right thing. If you are one of them, you are the best; thank you.
2 Task
Download the following data file from our unit site (Learning Resources ? Data):
nycflights13_weather.csv.gz
It gives the hourly meteorological data for three airports in New York: LGA, JFK, and EWR for the whole year of 2013. The columns are:
- origin weather station: LGA, JFK, or EWR,
- year, month, day, hour time of recording,
- temp, dewp temperature and dew point in degrees Fahrenheit,
- humid relative humidity,
- wind_dir, wind_speed, wind_gust wind direction (in degrees), speed and gust speed (in mph),
- precip precipitation, in inches,
- pressure sea level pressure in millibars,
- visib visibility in miles,
- time_hour date and hour (based on the year, month, day, hour fields) formatted as YYYY-mm-dd HH:MM:SS (actually, YYYY-mm-dd HH:00:00). However, due to a bug in the dataset, the data in this column are (incorrectly!) shifted by 1 hour. Do not rely on it unless you manually correct it.
Then, create a single Jupyter/IPython notebook (see the Artefacts section below for all the requirements), where you perform what follows.
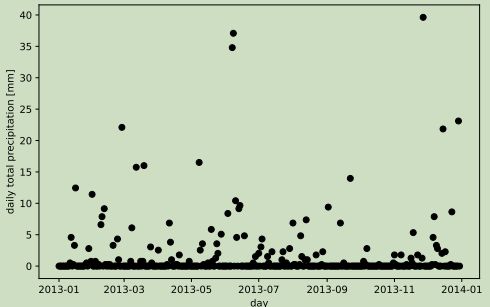
- Identify the 10 wettest days (dates and the corresponding total daily precipitation).
Reference result:
##
precip
## date
## 2013-11-27 39.624
## 2013-06-08 37.084
## 2013-06-07 34.798
## 2013-12-29 23.114
## 2013-02-27 22.098
## 2013-12-15 21.844
## 2013-05-08 16.510
## 2013-03-19 16.002
## 2013-03-12 15.748
## 2013-09-22 13.970
3 Additional Tasks for Postgraduate (SIT731) Students (*)
Postgraduate students, apart from the above tasks, are additionally required to solve/address/discuss what follows.
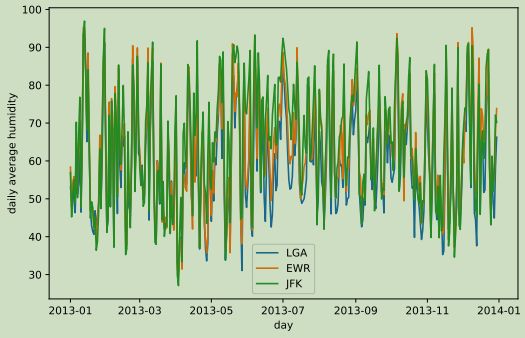
- Compute the daily mean humidity for the LGA, EWR, and JFK airports.
- Draw the daily mean humidity for the three airports on the same plot (three curves of different colours). Add a readable legend.
Reference result:
4 Optional Features (**)
The following suggestions are not part of the requirements for a pass grade, therefore you can skip them. Nevertheless, you might still want to tackle them, as only practice makes perfect.
- For the JFK airport, list all missing temperature readings. This should include not only the temperatures explicitly marked as missing values, but also the records that were completely omitted, for instance 2013-02-21 06:00:00.
- Add the missing records to the dataset (just the date-time information, with all the remaining fields being set to NaN).
- Compute the daily average temperatures, this time by linearly interpolating between the preceding and following non-missing data, e.g., a temperature sequence of [..., 10, NaN, NaN, 40, ...] should be transformed to [..., 10, 20, 30, 40, ...].
- Draw a plot of average daily temperatures comparing the missing value-omitted vs linearly interpolated cases.
5 Artefacts
The solution to the task must be included in a single Jupyter/IPython notebook (an .ipynb file) running against a Python 3 kernel. The use of G**gle Colab is discouraged. Nothing beats a locally-installed version where you have full control over the environment. Do not become dependent on third-party vendors. Choose freedom instead.
Make sure that your notebook has a readable structure; in particular, that it is divided into sections. Use rich Markdown formatting (text in dedicated Markdown chunks not just Python comments). Imagine it is a report that you would like to show to your manager or clients you certainly want to make a good impression. Check your spelling and grammar. Also, use formal language. At the start of the notebook, you need to provide: the title of the report (e.g., Task 42: How Much I LoveThis Unit), your name, student number, email address, and whether you are an undergraduate (SIT220) or postgraduate (SIT731) student.
Then, add 1-2 introductory paragraphs (an introduction/abstract what the task is about). Before each nontrivial code chunk, briefly explain what its purpose is. After each code chunk, summarise and discuss the obtained results (in a few sentences). Conclude the report with 1-2 paragraphs (summary/discussion/possible extensions of the analysis etc.). Finally, submitthe version of the Jupyter/IPython notebook converted toa PDFfile (e.g., via File ? Export Notebook As ? PDF or convert to HTML and from that to PDF with your web browser; any method will do). You do not need to submit the .ipynb file via OnTrack, but you must store it for further reference a marking tutor might ask for it later, e.g., at the end of the trimester.
