Data Wrangling And Visualization Assessment
- Country :
Australia
Section A Volcanos of the Holocene [10 marks]
The Global Volcanism Program (GVP) at the Smithsonian Institution maintains documentation on global volcanic activity. In this section you will use the GVPs database that catalogues volcanoes that have erupted in the last 10,000 years. The supplied dataset is:
- A2A volcanos.csv
Tasks:
a) [E] [1 mark]
Mount Vesuvius is a stratovolcano located in Italy that has erupted dozens of times. Does this dataset contain a list of all eruptions in the Holocene epoch and how do you know?
b) [C|O|E] [1 mark]
Examine the variables Latitude, Longitude, Elevation, and Last Eruption Date and comment on whether there are any range errors or missing data.
c) [C] [1 mark]
Create a numeric variable for last eruption date with negative values for BCE dates and positive values for CE dates.
d) [C|O|E] [1 mark]
Examine the frequency distribution of the numeric date variable that you created in part (c).
Is the interpretation that eruptions are becoming more frequent over time valid? Hint: try PROC HPBIN to perform bucket binning rather than PROC FREQ.
e) [C|O|E] [2 marks]
Categorise the variable tectonic_setting into two new variables:
- Platetype: Intraplate, Rift zone, Subduction zone
- Crusttype: Continental crust, Intermediate crust, Ocean crust
Your new variables should be coded numeric variables with custom formats applied. Show the frequency tables. What are the most common types of tectonic setting for volcanic eruptions?
g) [C|O] [1 mark]
Use an appropriate graph to show the frequency of tectonic settings (crust type and plate type).
h) [C|O|E] [1 mark]
Describe the distribution of elevation with appropriate summary statistics and a histogram.
I) [C|O] [1 mark]
Compare the distribution of elevation by plate type with summary statistics and a boxplot.
j) [E] [1 mark]
Inter-plate earthquakes are responsible for around 90% of the total seismic energy produced globally each year. Is our data consistent with this value? Why/why not? Note: Inter-plate includes rift zone and subduction zone (activity occurring at the boundaries of tectonic plates) as opposed to Intraplate activity which occurs inside plates.
Section B Global happiness index [15 marks]
The World Happiness Report ranks countries on the perceived happiness of their citizens. The happiness scores are based partly on data from the Gallup World Poll which is a nationally representative annual survey of each countrys population aged 15 and over. There are five domains of happiness: social support, healthy life expectancy at birth, freedom to make life choices, perceptions of corruption, and generosity. Another strong predictor of happiness is a countrys GDP per capita (Global Domestic Product per one hundred thousand population).
In this section you will explore, visualise, and interpret global happiness scores over the period 2015 2019. The supplied datasets are:
- A2B happiness_2015.csv
- A2B happiness_2016.csv
- A2B happiness_2017.csv
- A2B happiness_2018.csv
- A2B happiness_2019.csv
Tasks:
a) [C|O|E] [5 marks]
Prepare a new combined dataset for 20152019 using below instructions. Briefly document your decisions using code snippets and/or dot-points and tables.,/p>
- Create a long format dataset for 20152019 containing the following variables:
- Year
- Country
- Happiness_rank
- Happiness_score
- GDP_per_capita
- Social_support
- Healthy_life_expectancy
- Freedom_to_make_life_choices
- Perceptions_of_corruption
- Generosity
- You will need to harmonise the variable names since they are named differently in the older datasets (20152017) than in the newer ones (20182019). For example, the variable Family is the same as Social support.
- You will need to edit some country names. For example, Macedonia is now called North Macedon. Check that each country only has one observation per year.
b) [O] [1 mark]
Show a frequency table for the variable Year for the long dataset.
c) [C|O] [1 mark]
List the happiness ranks and happiness scores for Australia and the countries that were in the top 5 and the bottom 5 in 2019.
d) [C|O] [1 mark]
Create two graphs for the change in happiness score over time for the two groupings identified in part (c) respectively: the top five plus Australia and then the bottom five. Let SAS choose the natural scale for the vertical axis. Create the third graph with all eleven countries together.
e) [E] [1 mark]
How do we interpret what the above two types of plots are telling us in terms of the scale?
f) [C|O] [1 mark]
Create a scatterplot of life expectancy by GDP per capita for the year 2019.
g) [E] [1 mark]
How do we interpret the position of Saudi Arabia relative to Hong Kong in the scatterplot?
h) [C|O|E] [2 mark]
How well does economy (measured in terms of GDP per capita) correlate with the other five measures in the happiness index? Show the necessary workings and justify.
i) [C|O] [1 mark]
Use the geographical region variable from the 2015 dataset and merge this information into the stacked dataset. Show a frequency table of region by year.
j) [C|O] [1 mark]
Create a single plot that shows the distribution of happiness score by region. Only include regions in Asia, Europe, and Africa and make sure the regions appear grouped within these three super regions.
Section C Australian road safety [15 marks]
Over the last 50 years Australia has implemented a variety of successful interventions for reducing the number of fatalities and serious injuries on our roads including: seatbelts, licensing schemes, and targeted campaigns against drink driving and speeding. Along with safer vehicles and improved roads, these interventions have been shown to be effective in reducing road fatalities over time despite our growing population. National data on fatal crashes on Australian roads are recorded in the Australian Road Deaths Database (ARDD) maintained by the Bureau of Infrastructure and Transport Research Economics (BITRE).
In this question you will investigate data on fatal crashes from January 1989 to October 2020. The files provided are:
- A2C road crashes.csv
Details on the timing, location, and setting of crashes involving at least one fatality.
- A2C road fatalities.csv
Basic demographic information on people killed on roads.
- A2C ARDD data dictionary.pdf
Data dictionary for the variables in the road crashes and fatalities datasets.
- A2C ABS population data.xls
Quarterly population data for Australian states from June 1981 to March 2020 from the ABS.
Tasks:
a) [C|E] [5 marks]
Merge the crashes and fatalities datasets. Describe the relationship between these datasets and what checks you need to make to ensure the merge performs correctly.
b) [O|E] [5 marks]
Using the provided ABS time series data for the state populations, compare the number of fatalities and fatality rates per capita (deaths per 100,000 persons) by state over time. Describe the steps you have done to produce the results. Are Australian State roads becoming safer according to these statistics? Include appropriate graphs to support your answer. HINT: for the ABS population dataset you can delete unnecessary rows or columns in Excel before reading it into SAS.
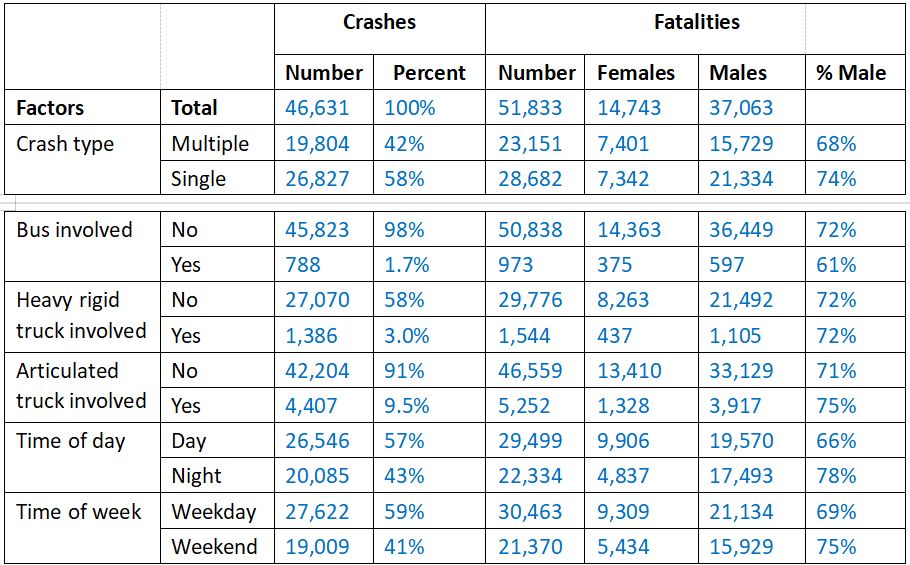
c) [E] [5 marks]
The below table contains the summary statistics of the road crashes and fatalities. Provide a concise (max 500 words) yet comprehensive report of relationships between different variables for the Royal Commission on Road Safety. Your report should describe the data from different dimensions/perspectives and refer to the specific numbers from the table, so that the Royal Commission is able to understand as many aspects of road safety as possible. Do not include any recommendations.