Draft A Report Highlighting" Exchange Rate Behavior"
- University :
La Trobe University Exam Question Bank is not sponsored or endorsed by this college or university.
- Country :
Australia
1. TASK OVERVIEW
Lecture 3 introduces the foreign currency market, its equilibrium condition, factors affecting the exchange rate, why the government controls it, and how government interferes in the foreign exchange market. Lecture week 4 introduces the concept of arbitrage and parity theories interest rate parity (IRP), purchasing power parity (PPP), and international Fisher effects (IFE) and forecasting. Lecture week 6 introduces the concept of measurement and management of exchanger rate risk, particularly examining the value at risk(VaR). Building on the concepts primarily related to Weeks 3 and 4, this Exchange Rate Report aims to test and expand your understanding to assess whether IRP, PPP, and IFE hold in the forex market for AUD/USD pair and forecast the exchange rates.
2. MAJOR TASK DETAILS
Background Work - Data Collection
The task requires using the following data collected from various open sources.
- Monthly interest and inflation rates for the allocated/chosen currency pairs countries.
Helpful Data Sources:
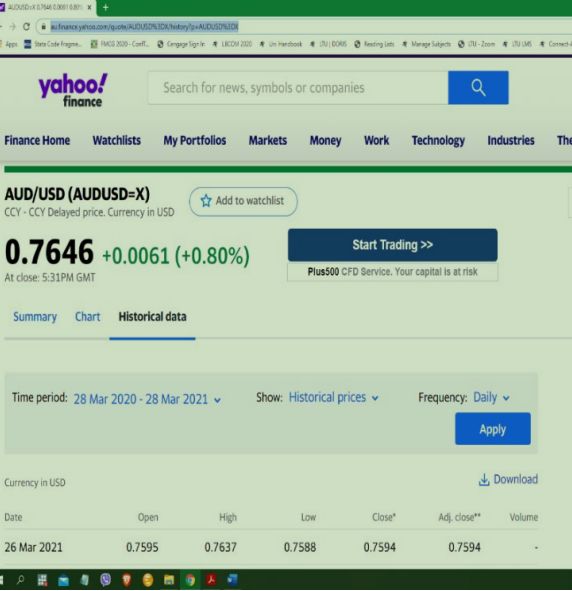
Yahoo Finance
(https://au.finance.yahoo.com/quote/AUDUSD=X/history?p=AUDUSD=X)
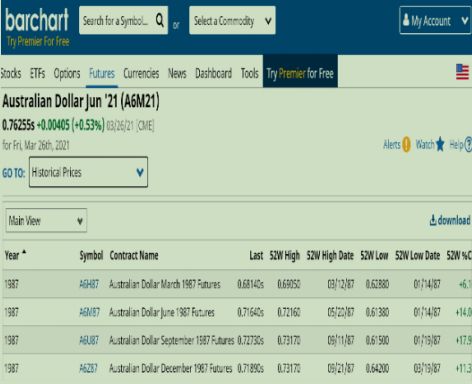
Barchart for future quotation
https://www.barchart.com/futures/quotes/A6*0/historical-prices?viewName=main
Federal Reserve Bank for monthly data
https://fred.stlouisfed.org/
For example, for monthly inflation rate
(https://fred.stlouisfed.org/graph/?g=1ED0) & monthly interest rate
(https://fred.stlouisfed.org/series/DGS3MO#0) in the USA.
Reserve Bank of Australia
for monthly interest and inflation rates in Australia. Similarly, central banks of other countries in your chosen currency pairs will be helpful. You can also use other reliable open data sources.
Summary statistics
You are required to examine the mean, median, and volatility of each data series. You can use graphs for meaningful visualization of your data series.
Examining the Behavior of the Exchange Rate
Present a meaningful economic explanation of chosen currency pairs' spot exchange rate trend. What are the main factors that explain the changes in the value of one currency against the other (i.e., AUD against USD) during the last five years? Use relevant factors that explain such variations in the exchange rates. These include economic factors such as trade volume and portfolio or other forms of investment, government intervention and policy regulations, political factors, global geopolitical risk, and conditions in commodity and other financial markets. You are expected to spend significant time in this section.
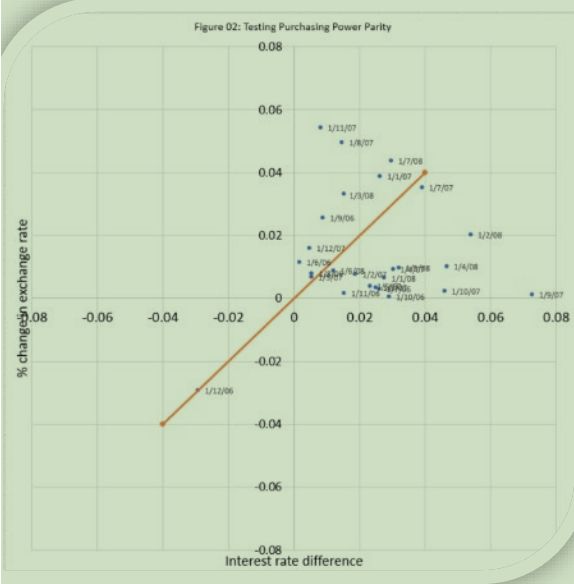
Testing IRP2, PPP, and IFE
Using the last five years (60 data points), examine whether IRP, PPP, or IFE holds. Present your result in tabular and graphical form. What implications can you draw from your analysis about potential actions by market participants (MNCs, Banks, forex traders)?
3. DETAILED REPORT & STRUCTURE
Cover Page
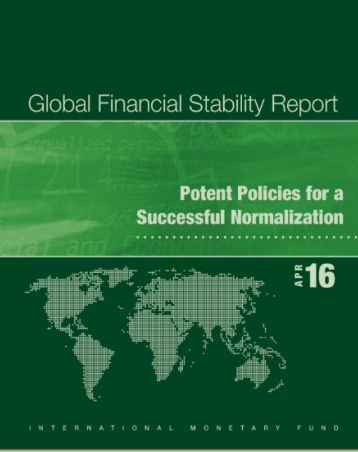
Create a professional cover page. You are training to be a professional. See the cover page of a recent report by IMF or the Discussion Paper by McKinsey Global Institute. Both are simple but professional. You can click the image and see the complete reports. I want you to draw inspiration from these or similar reports to prepare your cover page. Remember that you are aiming to work in these organizations.

Executive Summary
A summary of the key findings exchange rate behavior, forecasts, and implications.
Table of Contents
The table of contents presents the main headings and the subheadings of each topic/chapter/section. Ideally, the main and subheadings should be hyperlinked to the respective pages. It should label the page number for each section, as well.
Introduction
This section should highlight the background of this report what is the main focus, what this report wishes to achieve, and what is your main take always (findings), etc. Please keep it short.
Data and Summary Stats
This section should report the summary stats tables. Provide summary stats of each variable, any correlation among the variables, etc. Highlight any initial inference about the variables and potential implications for theexchange rate behavior you can draw.
This section should include an Appendix table highlighting data frequency monthly, quarterly, or yearly; the variables you collected, a brief definition of each variable, your data source for each variable, etc.
It can also highlight if you have used an alternative measure to define a variable, i.e., the future rate for forward rate, etc. You may also provide footnotes if you have used any techniques, i.e., average, interpolation, or extrapolation, to convert data to a different frequency than its original form.
Exchange Rate Behavior
This is an important section. Students are expected to provide the economic explanation not just in the theoretical sense but in the applied sense to justify the behavior of exchange rate movements in the spot market over the period.
Meaningful graphs are vital in setting the context to expand economic arguments. You must explain the primary and intermediate trends you have observed in the sport rate movement during the last five years.
A significant part of this section requires students to research online from credible sources, i.e., the Federal Reserve System (FRS), the central bank of the country pair country such as (the Reserve Bank of Australia), and reputed news articles, central bank press release or policy brief to identify policy measures regulatory, economic, and political undertaken by the respective governments that explain the behavior of exchange rate movement.
It is important to note that policies taken by other countries can also affect the value of your currency pairs. Similarly, international trade flows, trade restrictions, financial flows to support foreign direct investment or portfolio investment, investors' confidence in the forex market or other financial markets, sentiments, global geopolitical risk, commodity prices, etc., can also affect the exchange rate. All this information should be incorporated into explaining the behavior of the currency pairs allocated for you.
Future Exchange Rate
In this section, students should examine the trend of the future exchange rates and document how such trend diverges from the spot rates over the period.
Identify any discount or premium for each quarterly/monthly future exchange rate. Linking the regulatory, economic, and political policy measures is vital in explaining whether the premium or discount is justified.
Use charts, graphs, and tables to economize word count and improve the presentation and general readability.
Testing IRP, PPP, and IFE
The students should outline what IRP, PPP, and IFE are and how these parity theories are tested. What steps have been taken to test these theories using the last five years (60 data points)?
Use graphical presentation. If you are unsure how to create a four-quadrant scatter plot in Excel / Number, you can take help from YouTube.
The focus should be given to articulating the potential implications that can be drawn from your analysis about possible actions by marketparticipants (MNCs, Banks, forex traders, etc.). For example, whether speculation, covered interest arbitrage, and import and export increase are likely to occur due to a lack of IRP, PPP, and IFE if observed in the data.
Forecasting Exchange Rate
Analysts in the forex market are responsible, among others forecasting exchange rates in spot or derivative markets. For example, here are the REUTERS POLLS for USD index value against a basket of foreign currencies published on the Refinitiv platform over different windows.
http://fingfx.thomsonreuters.com/gfx/rngs/FOREX-POLL/010031QJ3YY/index.html
Poll Summary
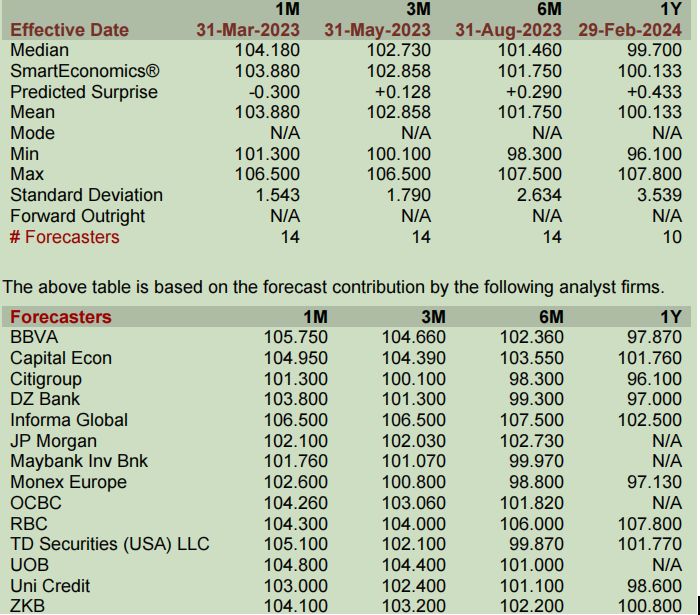
Similarly, students are required to provide a forecast of the exchange rate of the chosen currency pair over 1 month and 3 months periods. Students are expected to employ a range of forecasting techniques (technical, fundamental, market-based, and mixed forecasting).
You should provide sufficient details process or steps followed, forecasted figure, and the justification behind both 1 month and 3 months period forecast. You are expected to incorporate the effect of any economic and market-level uncertainties in the final forecast.
Determine the forecast error or surprise by comparing it with realized value in the market. Finally, determine the forecast volatility using a historical pattern of forecast volatilities.
