BUS5PA Building And Evaluating Predictive Models Using SAS Enterprise Miner Assessment
- Subject Code :
BUS5PA
- University :
La Trobe University Exam Question Bank is not sponsored or endorsed by this college or university.
- Country :
Australia
Predictive analytics uses algorithms and information learning techniques to identify through the use of data, future trends by showcasing what has taken place as part of analyzing, calculating the scenarios for the future. Predictive analysis and modeling are an important tool for businesses and industries as a whole, that is no different for Beta Ltd as a medium for linking buyers and sellers of automobiles. There are several variables that have to be taken into consideration when constructing a platform such as this, in case of the industry in which Beta Management currently functions having a firm understanding of complexities relating to customer perception of brands, that rise from the type of car and individual prefers, model, the size of the vehicle and the price that goes along with it etc. The four different brands taken into consideration all offer different value in terms of quality and degree of options when it comes to number of models on offer for different types of individuals looking at different price options.
A)
All four brands are different from one another and have a lot of facets that make them distinguishable from one another one key factor being that two of the four brands in consideration, BMW and Mercedes, are considered as luxury brands that manufacture high end cars that are sold at higher prices in comparison to Toyota and Honda that are not considered brands only catering for consumers looking at high end prices but for a wider target audience by offering products at different price ranges. The data set available to help construct the predictive model consists of several different elements pertaining to what might influence a buyers opinion about a certain vehicle or brand.
The company Toyota for example, is a brand which has a large portfolio of vehicles with several different types of characteristics. The major characteristic that was most distinguishable when considering the vehicles sold by the company itself was the type of vehicle the company sells. The portfolio of the company consists of SUVs, Utes, Hybrids, sedans etc. and these types of vehicles make up a large portion of the Australian market alone. This was the case with all the other care brands as well. In all the datasets the most preferred type of car were sedans. (as shown in the below figure-Mercedes)
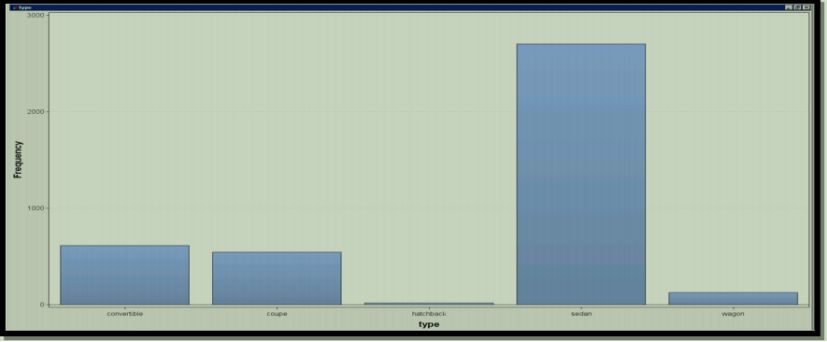
The preference each consumer has over a type of vehicle they want to purchase stems from personal use and requirement they might have of a certain vehicle for example one person might have a requirement for fuel conservation, another might want the drive of the vehicle to be as smooth as possible etc. These requirements where taken into account when constructing the model, majority of class target consisted of sedans as a preferred mode of transportation when choosing a vehicle.
When the model ran the variables, we were able to see that fuel was significant in influencing an individuals choice of brand, and in this case their choice of brand was Toyota. When in comparison with the other three brands, Toyota has a reputation of manufacturing cars that are considered fuel efficient and reliable, using traditional and modern forms of technology such as gas powered and electric engines. If we are to take into account, the different features and options on offer from other companies such as BMW, Mercedes, and Honda then there are several high operating features and conservative features that make those brands distinctive to Toyotas. The ability to offer products within an affordable range with a multitude of vehicles in its portfolio makes the companies extremely distinctive. If we look at the price variance of all vehicles on offer by the company that includes convertibles, coupes, hatchbacks, sedans and wagons, we are able to see sedans have the highest rate of skewness when comparing it to other vehicles when taking into consideration price.The skewness for sedans is positive and towards the right as compared to others meaning the variance in price to demand is higher for sedans manufactured by Toyota as compared to other brands, so consumer perception to price varies for Toyota as compared to other brands.
In all the four brands even with distinctions the fuel type customers choice of gas surpassed others with a great difference and same is the case with the choice of transmission which was automatic for majority of the customers across the four brands. (Example of Honda shown in the below figure)
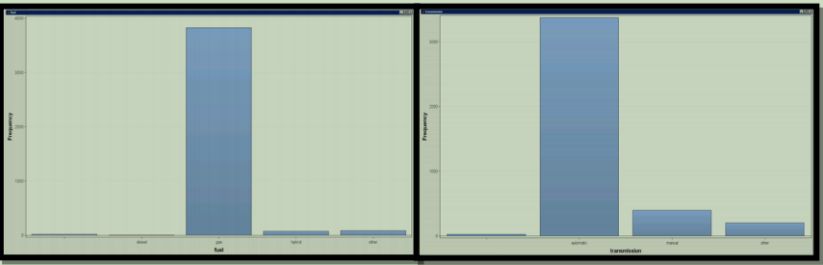
These similarities in the four brands tell us a lot about the similarity in choices of the customers.
Majority of the customers preferred vehicles which fall in the years 2007-2018. This may be because of the fact that the performances of these cars are good and are comparatively cheaper than the newer cars.
Another important variable is the odometer reading. Which signifies that as the odometer reading increases the less the customer wants to buy that vehicle.
The above discussion tells us that customer choices are inclined towards some of the features more than the others (like gas, sedans, automatic, etc.). The companies such as Mercedes and BMW have cars which have higher prices than that of Toyota and Honda & therefore compete for different customer market segmentations. For e.g. The choice of no. of cylinders- In Mercedes and BMW the choices are more inclined for 6 cylinders followed by 8 cylinders, whereas in the case of Toyota and Honda the choices are inclined towards 4 cylinders. So, these distinctions also help to identify the choices and behavior of customers and hence predict the prices of cars better.
B)
The SSE of the regression model for Toyota is around 993.39 and 437.61 for validation, at the same time the SSE for the tree diagram for Toyota is 993.20 and 437.79 for validation respectivly. If we are to compare both separate models then the tree diagram for Toyota would be the more ideal model of selection as the degree of error for it is lower. Same is the case with that of BMW and Honda.
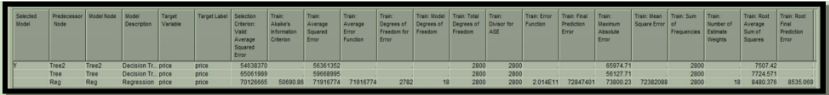
The Decision Tree with three splits is selected as the better model in the BMW dataset as the selection is based on the Average squared error(as shown in the below figure). In the dateset of BMW the decision tree model provides the least average squared error, hence, being a better model and higher predective performance of the model in predicting the house prices.
Similar is the case with the the dataset of Honda, where decision tree is selected as the most appropriate model because of its predective performance, where the decision trees have less variation between the predicted and the actual price of the vehicles.
In the case of Mercedes the Regression model is selected as the best prective model for predicting the housing prices(Shown in below figure).
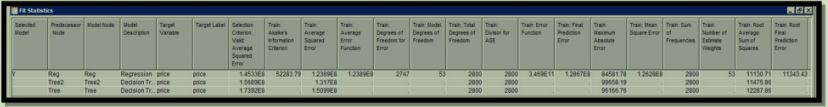
Overall, the decision tree is selected as the most appropriate model, as the predective performance of the decision tree model is higher than that of the regression models.
The decision tree models work better than any other models when there are a lot of missing values present, when there are a mix of numerical and categorical varibles present or when there are huge variations in the balance of characteristics. (Dan,n.d.)
However it is really important to construct different models as different models perform distinctively with dissimilar datasets.
C)
Part of data analytic is to compute large chunks of data and information to make it comprehensible for formulating future strategies. If we are to look at how the predictive model for Toyota compares to the rest of the companies, we are able to see how variable factors such as fuel type or size of vehicle or model type has an influence over the demand and price of the vehicles sold by Toyota. The problem that lies in comparing models for the other respective companies is that all other companies do not have as big a portfolio as compared to Toyota whereas companies like BMW and Mercedes mainly target high end consumers in comparison with a company like Toyota that caters to a wider consumer network, especially in a country like Australia.
For constructing better car predictive price models, a few more variables should be used.
For example: - no. of doors in the car, the average (kms/liter of oil) of the car or kms in one charge for electric, upgrades in the vehicle, no. of seats in the vehicle, engine horsepower, etc.
Further, we can compare more models in assessing the price prediction of the cars. In filling the missing values instead of using fill method we can see If there are any indicators of reasons behind the missingness of the values.
If we implement the above recommendations the car price prediction model for Beta Management can be made more effective.
