Applied Statistical Analysis in Real Estate Economics STA3051
- Subject Code :
STA3051
Introduction
In this analysis, an attempt is made to investigate the determinants of the auction prices of residential real estates in Melbourne. This involves assessing whether or not real estate prices are significantly different in the various regions, particularly the cardinal directions of East, West, North, and South. The dataset possesses rich enough variables of price, region, and building area of houses for a comprehensive analysis of these differences. The given analysis has further calculated the price per square meter, which gave further insight into the trend of property values across varied regions. In conducting statistical tests such as Levene's Test for equality of variance and Welch's F-test for comparison of means, this study aims to provide actionable insights on how property prices and values per square meter vary across Melbourne's regions.
Data Preparation
Data cleaning was quite elaborate to ensure that the analysis was accurate and reliable. The dataset initially contained several missing values, especially in the columns of price, region, and building area. These missing values were removed to prevent skewing the results. A new variable, Price per Square Meter, was then created by dividing the price of each house by its building area after cleaning. It also helps to gain an understanding of the relative value of properties across regions in Melbourne, since this metric provides a more normalized comparison on price for size.
Test of Variance Equality (Levenes Test)
Levene's test is implemented to check if the variances of property prices across the regions are equal. This test checks for equality of variances, which is an assumption before running ANOVA or Welch F-test. Figure 1 below, from the results outcome of Levene's Test, it was observed that there were significant differences in variance between regions and p-value less than 0.001 indicated (Romaito, et al., 2021). This will mean that for this data set, the assumption of equal variances has failed to hold. Since the variances are not equal, the classical ANOVA F-test is not appropriate, so Welch's F-test, without the assumption of equal variances, was applied to test variations in the mean property prices across regions.
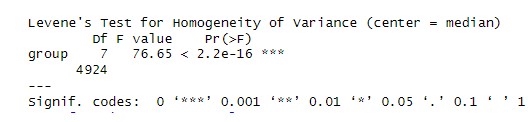
Figure 1: Summary of Levene's Test
The results of the test via Levene's were a highly significant F-value of 76.65, implying that there was indeed strong evidence against the null hypothesis of equal variances. It was highly significant; p < 0>
ANOVA/Welch F-Test
Since Levene's Test produced a significant outcome, a Welch's F-test was run to examine whether or not there are significant differences between the average prices of properties across the eight regions. Welch's F-test corrects for unequal variances and is valid and relevant when there is this kind of condition (Fu, Moerbeek, and Hoijtink, 2022). The outcome of Welch's F-test Figure 3 gave a highly significant result with a p-value of less than 0.001. The test statistic was 358.27 with 7 and 244.21 degrees of freedom. This implies that the mean property prices in regions differ significantly.
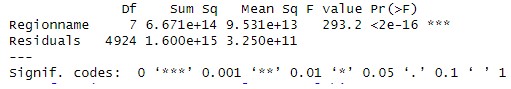
Figure 2: Summary of ANOVA Result
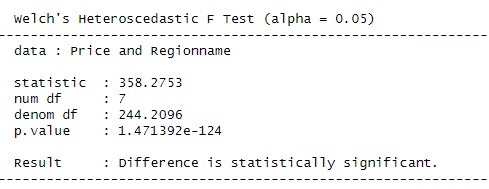
Figure 3: Welch's Tests Summary
Where ANOVA is inappropriate due to unequal variances, for comparative purposes, the ANOVA summary did yield a significant result with a p-value of less than 0.001. Following this, the result of the Welch's F-test was significant, indicating that there is a significant difference in mean prices among those regions. Hence, this large test statistic of 358.27 further evidences the price difference being big out of variance among the regions in Melbourne.
Subgroup Analysis: Price per Square Meter by Region
Moreover, value differences on property were explored across the regions to a greater extent by subjecting the price per square meter by region into a subgroup analysis. The results revealed that the mean price per square meter was highest in the Southern Metropolitan at 10,080 AUD/m?2;, then Eastern Metropolitan with 7,381 AUD/m?2;, followed by Northern Metropolitan with 7,002 AUD/m?2;, and the least was the case of Western Victoria, which was 3,670 AUD/m?2;. This huge range in price per square meter reflects regional differences in the value of land and property across Melbourne.
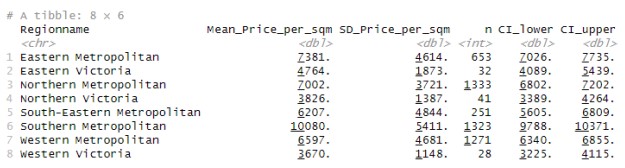
Figure 4: Proce Per Square Summary
This analysis also yielded a confidence interval for each region, which differed for the highest- and lowest-valued regions: "The 95% confidence interval for the Southern Metropolitan area ranges between 9,788 and 10,371 AUD/m?2;". It is considerably higher compared to other regions.
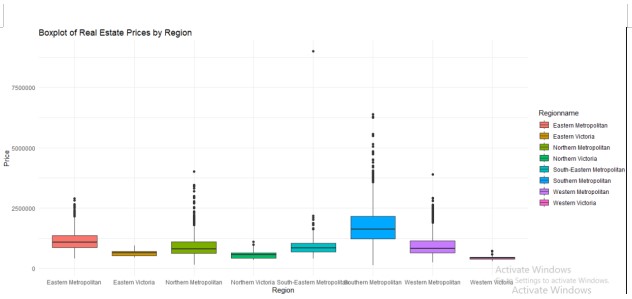
Figure 5: Boxplot of Real Estate Price by Region
The boxplot confirms visually the results of Welch's F-test, which consistently showed property prices highest in the Southern Metropolitan region, followed by the Eastern and Northern Metropolitan. Another important issue brought out is that the spread of prices within each region varies widely, with some areas showing much higher variability than others, particularly the higher-priced Southern Metropolitan region.
Post-Hoc Analysis
Since the Welch's F-test outcome was significant, post-hoc pairwise comparisons through t-tests with the Bonferroni adjustment have been performed so as to see exactly which pairs of regions are those that differ from each other regarding mean property prices. The results, as depicted by Figure 6, showed that the Southern Metropolitan region consistently presented a significant difference compared to the rest of the other regions, as told by the p-values with almost less than 0.001 in most of the comparisons. Furthermore, there were significant differences between the Eastern Metropolitan and the rest, which again told about the price disparity across Melbourne.
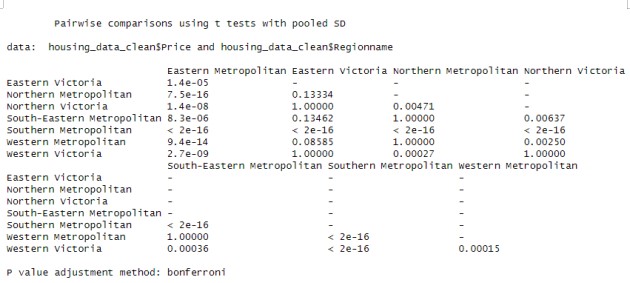
Figure 6: Post Hoc Analysis using Pairwise T-Tests
The pairwise comparisons also ensure that property prices are very different between regions. For example, comparing Southern Metropolitan to Western Victoria yields a p-value of less than 0.001, indicating quite a wide difference in the mean property prices between the two regions.
Conclusion
There are significant differences in real estate prices among the regions of Melbourne. The F-test by Welch, following Levene's Test which established unequal variances, showed overall significant differences in property prices. The average price was highest for Southern Metropolitan among the regions. In the price per square meter analysis, it was similar: the most expensive region per square meter is Southern Metropolitan, followed by Eastern, then Northern Metropolitan. Indeed, the posthoc pairwise tests do indicate that Southern Metropolitan is significantly different from most of the other regions. These results strongly indicate that in Melbourne, regional differences are an important determinant of property values; the Southern Metropolitan region commands a clear premium. Such information can be useful for real estate stakeholders like buyers, sellers, and investors to make appropriate decisions in the Melbourne area about property transactions.
Are you struggling to keep up with the demands of your academic journey? Don't worry, we've got your back!
Exam Question Bank is your trusted partner in achieving academic excellence for all kind of technical and non-technical subjects. Our comprehensive range of academic services is designed to cater to students at every level. Whether you're a high school student, a college undergraduate, or pursuing advanced studies, we have the expertise and resources to support you.
To connect with expert and ask your query click here Exam Question Bank
