BNS-3513 Research Methodology Assessment
- Subject Code :
BNS-3513
- University :
UNIVERSITY OF FUJAIRAH COLLEGE OF INFORMATION TECHNOLOGY Exam Question Bank is not sponsored or endorsed by this college or university.
- Country :
United Arab Emirates
Procedure
Part 1: Simple Linear Plot
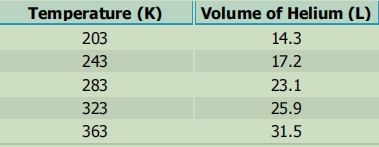
Scenario: A certain experiment is designed to measure the volume of 1 mole of helium gas at a variety of different temperatures, while keeping the gas pressure constant at 758 torr:
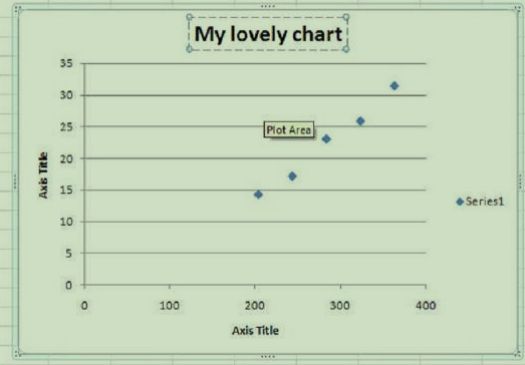
- Your next step is to add a trendline to the plotted data points. A trendline represents the best possible linear fit to your data. To do this you first need to "activate" the graph. Do this by clicking on any one of the data points. When you do this, all the data points will appear highlighted.
- Click the Chart Elements button next to the upper-right corner of the chart.
- Check the Trendline box.
- Click More Options. This will display the option shown in Figure 7.
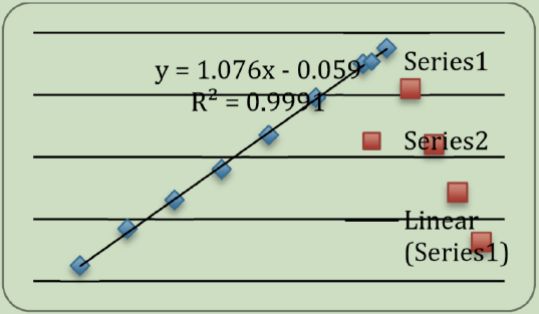
- Notice that the Linear button is already selected. Now select the Display Equation on Chart box and the Display R-squared value on Chart box. Then click the Close button.
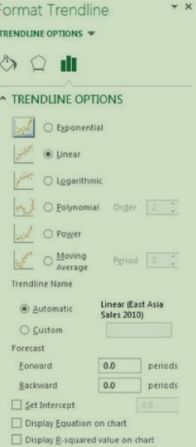
- The equation that now appears on your graph is the equation of the fitted trendline. The R2 value gives a measure of how well the data is fit by the equation. The closer the R2 value is to 1, the better the fit. Generally, R2 values of 0.95 or higher are considered good fits. Note that the program will always fit a trendline to the data no matter how good or awful the data is. You must judge the quality of the fit and the suitability of this type of fit to your data set.
- Print out a full-sized copy of your prepared graph and attach it to your report.
Then record the following information on your report:- the equation of the best-fit trendline to your data
- the slope of the trendline
- the y-intercept of the trendline
- whether the fit of the line to the data is good or bad, and why.
- By graphing the five measured values, a relationship is established between gas volume and temperature. The graph contains a visual representation of the relationship (the plot) and a mathematical expression of the relationship (the equation). It can now be used to make certain predictions.
For example, suppose the 1 mole sample of helium gas is cooled until its volume is measured to be 10.5 L. You are asked to determine the gas temperature.
Note that the value 10.5 L falls outside the range of the plotted data. How can you find the temperature if it doesn't fall between the known points? There are two ways to do this.
Method (1): Extrapolate the trendline and estimate where the point on the line is.
- Click on the Layout tab along the top menu, then Trendline > More Trendline Options.
- In the section labeled Forecast enter a number in the box labeled Backward, since we want to extend the trendline the backward x direction. To decide what number to enter, look at your graph to see how far back along the x-axis you need to go in order to cover the area where volume = 10.5 L. After entering a number, click Close, and the line on your graph should now be extended in the backward direction.
- Now use your graph to estimate the x value by envisioning a straight line down from y = 10.5 L to the x-axis. Record this value on your report.
Method (2): Plug this value for volume into the equation of the trendline and solve for the unknown temperature. Do this and record your answer on your report.
Note that this method is generally more precise than extrapolating and "eyeballing" from the graph.
Part 2: Two Data Sets with Overlay
Scenario: In a certain experiment, a spectrophotometer is used to measure the light absorbance of several solutions containing different quantities of a red dye.
The two sets of data collected are presented in the table below:
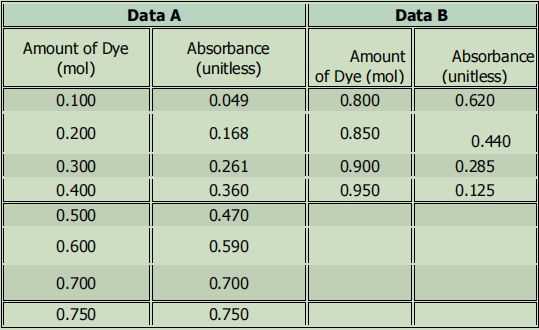
You would like to see how these two sets of data relate to each other. To do this you will have to place both sets of data, as independent relationships, on the same graph.
Note that this process only works when you have the same axis values and magnitudes.
- Print out a full-sized copy of your prepared graph and attach it to your report.
Then record the following information on your report:- the equation of the best-fit trendline for Data A,
- the equation of the best-fit trendline for Data B,
- If these trendlines were extrapolated, they would intersect. Determine the values of x and y for the point of intersection using simultaneous equations.
Part 3: Statistical Analysis and Simple Scatter Plots
When many independent measurements are made for one variable, there is inevitably some scatter (noise) in the data. This is usually the result of random errors over which the experimenter has little control.
Scenario: Ten different students at two different colleges each measure the sulfate ion concentration in a sample of tap water:
Simple statistical analyses of these datasets might include calculations of the mean and median concentration, and the standard deviation. The mean (xx) is simply the average value, defined as the sum (??) of each of the measurements (xixi) in a data set divided by the number of measurements (NN):
The median (MM) is the midpoint value of a numerically ordered dataset, where half of the measurements are above the median and half are below. The median location of NN measurements can be found using:
M=N+12(1.7)(1.7)M=N+12
When NN is an odd number, the formula yields a integer that represents the value corresponding to the median location in an ordered distribution of measurements. For example, in the set of numbers (3 1 5 4 9 9 8) the median location is (7 + 1) / 2, or the 4 th value. When applied to the numerically ordered set (1 3 4 5 8 9 9), the number 5 is the 4th value and is thus the median three scores are above 5 and three are below 5. Note that if there were only 6 numbers in the set (1 3 4 5 8 9), the median location is (6 + 1) / 2, or the 3.5th value. In this case the median is half-way between the 3rd and 4 th values in the ordered distribution, or 4.5.
Standard deviation (ss) is a measure of the variation in a dataset, and is defined as the square root of the sum of squares divided by the number of measurements minus one: s=?(xi?x)2N?1???????????(1.8)(1.8)s=?(xi?x)2N?1
So to find ss, subtract each measurement from the mean, square that result, add it to the results of each other difference squared, divide that sum by the number of measurements minus one, then take the square root of this result. The larger this value is, the greater the variation in the data, and the lower the precision in the measurements. While the mean, median and standard deviation can be calculated by hand, it is often more convenient to use a calculator or computer to determine these values. Microsoft Excel is particularly well suited for such statistical analyses, especially on large datasets.
- Enter the data acquired by the students from College #1 (only) into a single column of cells on a fresh page (Sheet 4) in Excel. Then in any empty cell (usually one close to the data cells), instruct the program to perform the required functions on the data. To compute the mean or average of the data entered in cells a1 through a10, for example, you must:
- click the mouse in an empty cell
- type "=average(a1:a10)"
- and press return
To obtain the median you would instead type =median(a1:a10). To obtain the standard deviation you would instead type "=stdev(a1:a10)". - Record on your report:
- As an additional exercise, calculate the standard deviation of this dataset by hand, and compare it to the value obtained from the program.
Part 4: Report writing ---------------------- -2.5 marks
Each point carries 0.1 marks.
Report Should contain
- Preface
- Problem statement
- Subproblem 1
- Objectives
- Importance of the research
- Plans
- Methods
- The hypotheses
- The delimitations
- The definitions of terms? The assumptions
- The importance of the study
- The review of the related literature
- An outline of the proposed study (steps to be taken, timeline, ere.)
- Data Collection Tools
- Analysis
- Conclusion or Finding
- Recommendations
Are you struggling to keep up with the demands of your academic journey? Don't worry, we've got your back! Exam Question Bank is your trusted partner in achieving academic excellence for all kind of technical and non-technical subjects.
Our comprehensive range of academic services is designed to cater to students at every level. Whether you're a high school student, a college undergraduate, or pursuing advanced studies, we have the expertise and resources to support you.
To connect with expert and ask your query click here Exam Question Bank
