Building And Testing Classifiers In WEKA Assignment
- Country :
Australia
Task 1
Question 1
To answer this question, let us analyze the histograms of some numerical attributes.
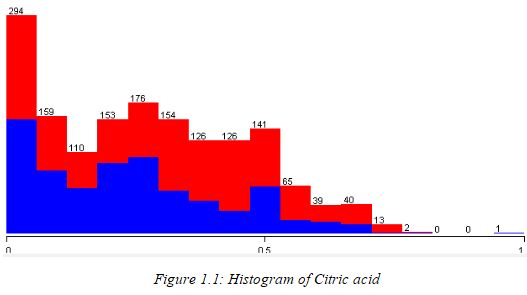
This is a binary classification problem where the wine is classified as either good or bad based on the ratings provided by the experts. In the dataset, quality represents the categorical variable having two values, good or bad. Thus, we can conclude that quality does not follow a hump distribution. Now, consider the histogram of citric acid variable (Refer Figure 1.1). Here, the peak of the distribution appears at the start of the histogram. All the remaining values are to the right of this peak. This means that this attribute contains only on the right side of the peak, none to the left. Thus, we can say that citric acid does not seem to have a hump distribution.
The attributes total sulphur dioxide, free sulphur dioxide, alcohol seems to be a right-skewed distribution having more values to the right of the peak than the left (Refer Figure 1.2).
Thus, the following attributes does not seem to have a hump distribution:
- Quality
- Citric acid
- Alcohol
- Total sulphur dioxide.
- Free sulphur dioxide
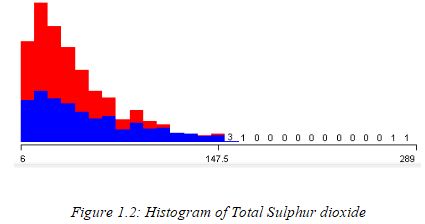
Outliers are values which lie far away from the quantiles of the histogram (Refer Figure 1.2). Based on this, the attributes Residual sugar, Chlorides, Total sulphur dioxide and Sulphates seem to have at least one outlier in it.
For an attribute to contribute most to the classification, it must be able to distinguish between the two groups by displaying unique patterns or discrepancies in the distributions in order to properly categorise the wine as either good or bad. The "alcohol" attribute appears to exhibit the most distinctive patterns in the histogram for the two groups out of all the numerical variables included in the dataset. The data's spreadand scope appear to be advantageous for categorization. The most helpful feature for categorising wine based on the histogram is "alcohol" since the distributions of the two groups are different.
Are you struggling to keep up with the demands of your academic journey? Don't worry, we've got your back! Exam Question Bank is your trusted partner in achieving academic excellence for all kind of technical and non-technical subjects.
Our comprehensive range of academic services is designed to cater to students at every level. Whether you're a high school student, a college undergraduate, or pursuing advanced studies, we have the expertise and resources to support you.
To connect with expert and ask your query click here Exam Question Bank
