Ceiling Jets Assessment
- Country :
Australia
Objective:
To investigate the properties of an unconfined ceiling jet flow involving a pool fire.
Apparatus:
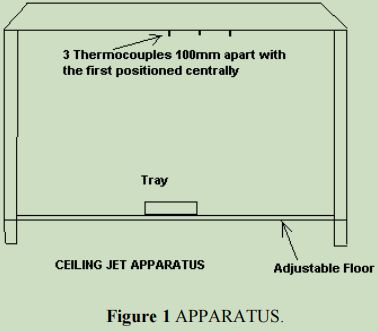
The apparatus consists of an unconfined ceiling jet flow apparatus with an adjustable floor allowing the height of the ceiling to be easily altered (See figure 1). Three type K thermocouples are employed as shown in figure one. A Computerized data logging system is employed to provide results. Three sizes of metal fuel trays are provided.
Theory:
For a ceiling jet situation it has been suggested that the maximum temperature at ceilings of height H along the fire axis is given by.
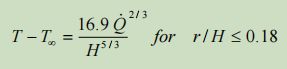
Where Q is the rate of heat output from the pool fire.
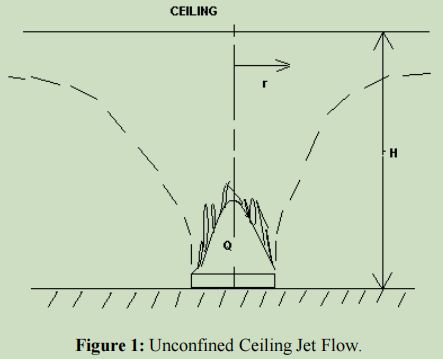
For the radial temperature variation (Figure 2) the following expression is valid.
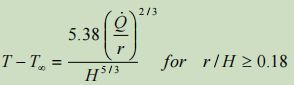
Examining the expression for r/H <=0.18 and simplifying by assuming quasi steady state conditions then the equation may be simplified to:
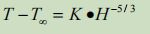
Where K is a constant or:
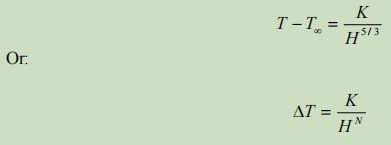
Employing Logs:
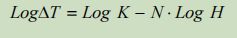
Where N is a constant and may be determined graphically in the form of the gradient of a plotted straight line of Log of T versus Log H. Log K is the Log of the intercept. Note employ temperatures at approx steady state.
Procedure:
- Locate the thermocouples and ensure they are correctly connected to the data logging equipment carefully noting the identity of each channel.
- Set the height to an initial distance e.g. 1.4 m.
- Set in a tray of methylated spirits (300ml approx.. for each tray size).
- Initialise the data recording devices,
- Light taper provided and carefully ignite the fuel whilst simultaneously starting the recording devices,
- Pay close attention to the flames and make relevant observations
- Repeat the experiment for four more heights and each tray size (heights of 1.2m, 1.0m, 0.8m and 0.6m).
- From the resulting data test the correlation suggested employing thermocouple two to prove the relationship i.e. N = -5/3.
Results and Observations:
Record clearly any observations made.
Analysis of Results:
- Using the data from the logging equipment plot graphs of the Log of ?T versus Log H and determine Both K and N.
- Make pertinent comments regarding the shape of the graphs,
- Plot temperature versus time graphs for the three thermocouple readings for each test and analyse.
- Make any relevant comments.
Conclusions:
Record any relevant conclusions you have made as a result of carrying out these experiments.
Are you struggling to keep up with the demands of your academic journey? Don't worry, we've got your back! Exam Question Bank is your trusted partner in achieving academic excellence for all kind of technical and non-technical subjects.
Our comprehensive range of academic services is designed to cater to students at every level. Whether you're a high school student, a college undergraduate, or pursuing advanced studies, we have the expertise and resources to support you.
To connect with expert and ask your query click here Exam Question Bank
