Discuss the Measure For The Rate Of Cooling In Various Substances And Use The Data Obtained To Create Graphs Depicting The Cooling Curve
- Country :
Australia
Writing up
Step by step
Cooling Curve
Aim:
The investigations' goal was to measure the rate of cooling in various substances and use the data obtained to create graphs depicting the cooling curve for each.
Introduction:
Calorimetry
Calorimetry is a fundamental technique taught to us that involves measuring changes in heat energy during physical or chemical processes. During these practicals, I learned how to use calorimeters to isolate reactions and systems, as well as determine heat capacity, specific heat capacity, and enthalpy changes. I have also gained measurement, data analysis, and an understanding of thermodynamics through practical experiments, which will be useful in fields such as chemistry, physics, and engineering.
Cooling curve
A cooling curve is a graphical representation of a substance's temperature changes as it cools down over time. By observing the curve, I was able to calculate cooling rates and determine phase changes such as solidification. It provided useful information about heat transfer and material behaviour.
Calibration
The process of adjusting and verifying the accuracy of scientific instruments in order to ensure precise and reliable measurements is known as calibration. I learned to compare instrument readings to reference standards, make adjustments as needed, and document calibration results. This critical skill contributed to the reduction of errors and uncertainties in experimental data, thereby improving the quality and validity of scientific measurements in a variety of laboratory and professional settings.
Calibrating a thermometer
- Fill a container with ice, then top it off with water to the top.
- Place the thermometer in the ice water and watch it until it stabilises.
- Take a temperature reading.
- Place the thermometer inside a pot of boiling water.
- After it has stabilised, take a temperature reading.
- Carry out the procedure once more using warm water.
- To calibrate your thermometer, use this criteria.
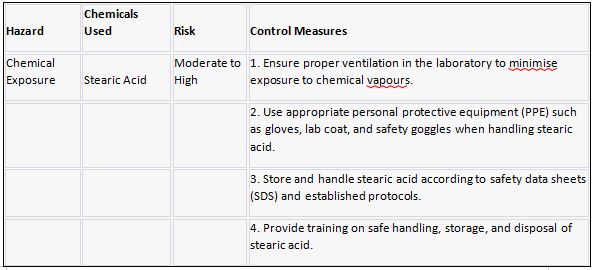
Stearic Acid
Stearic acid is investigated as a solid, waxy saturated fatty acid. It is derived from animal and vegetable fats and oils and is soluble in organic solvents but insoluble in water. I discovered that its high melting point contributes to its stability and use in candles, soaps, and cosmetics, as well as as a lubricant in industries such as plastics and metal processing.
In comparison to many other fatty acids, stearic acid has a relatively high melting point. Stearic acid has a melting point of 69-71 degrees Celsius (156-160 degrees Fahrenheit). It is important to note that the melting point can vary slightly depending on factors such as sample purity and experimental conditions.
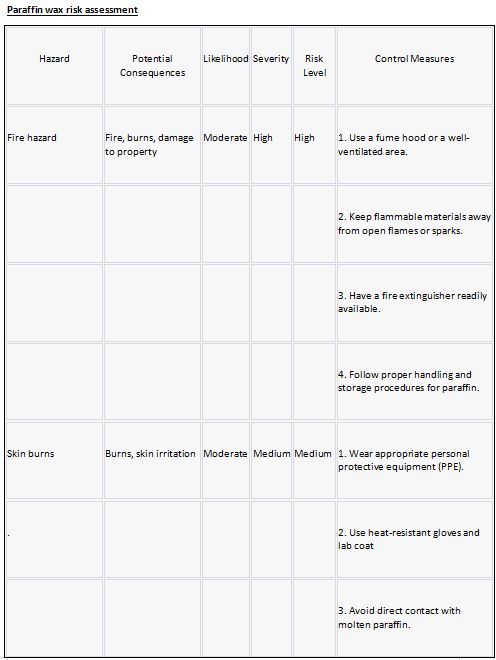
Paraffin wax
Paraffin wax is a petroleum-based product. It is a solid, odourless material with a low melting point that can be used to make candles, lubricants, waterproofing, and wax-based products. Because of its high heat capacity, it can absorb and store heat energy, making it useful in heat transfer and as a phase change material. However, due to its flammability, precautions should be taken.
Distilled water
In calorimetry, distilled water is used as a standard substance to gauge the heat capacity of other substances. It can be used to calibrate calorimeters before determining the heat capacity of an unknown substance because it has a known specific heat capacity.
Practical Summary
What did you do in the practical for both stearic acid and paraffin?
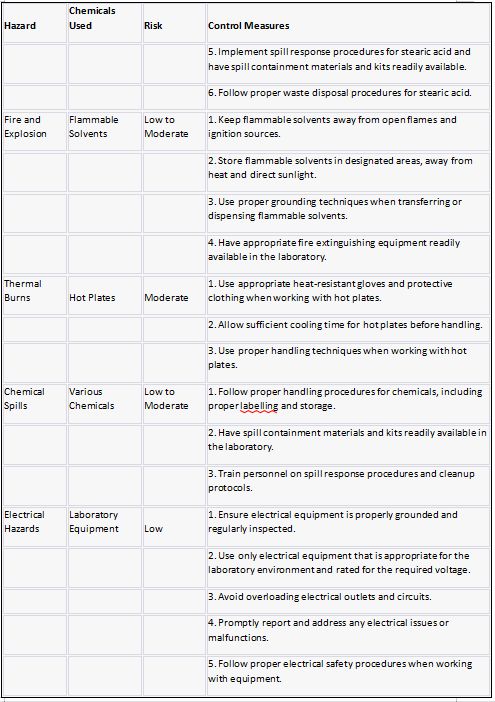
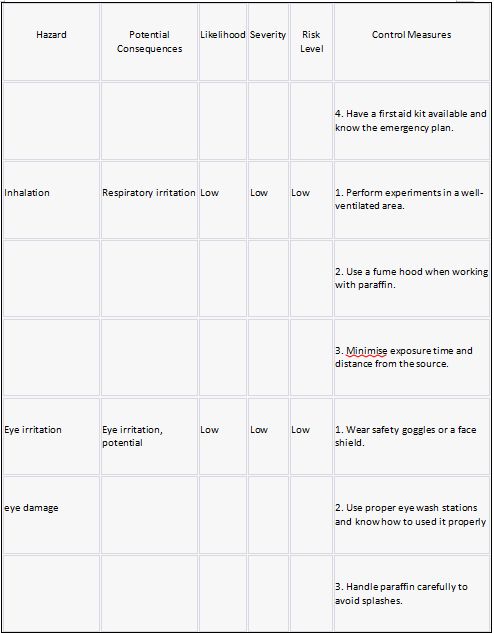
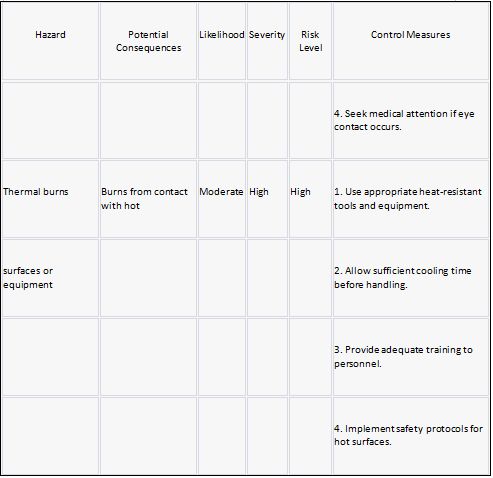
Risk assessment:
Risk Hazard Prevention
Stearic acid Risk assessment:
Calibration
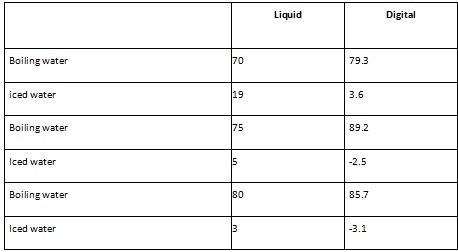
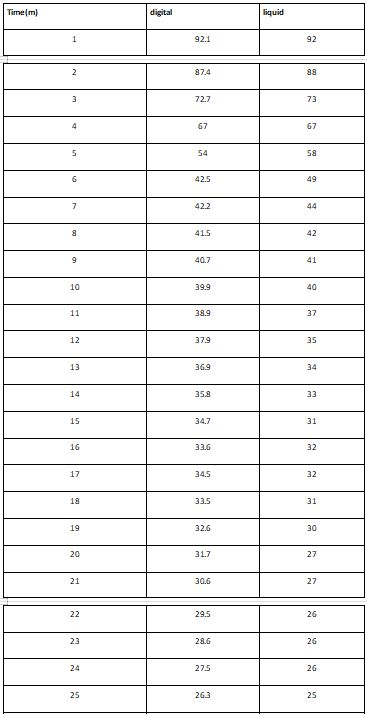
The digital thermometer is more accurate in my opinion as it can be attributed to its ability to display decimal places and negative temperatures. This allows for a finer resolution in temperature measurement, enabling you to record more precise values. The decimal places provide greater detail and accuracy in representing the temperature, especially when dealing with small temperature changes or variations.
On the other hand, when I mention the liquid being more precise based on the results being closer together, I am referring to the consistency or repeatability of the liquid measurements. This is known as precision, which reflects the degree of agreement between repeated measurements of the same quantity under similar conditions. In your experiment, if you consistently obtained similar values when measuring the liquid, it indicates that your measurements were precise.
Precision is important because it provides an indication of the reliability and consistency of your experimental procedure. Precise measurements allow for better comparison between samples or different experimental runs. However, it's important to note that precision does not necessarily guarantee accuracy. Accuracy refers to the closeness of a measurement to the true or accepted value.
In my case, the digital thermometer's accuracy has been enhanced by its ability to display more decimal places and negative temperatures. However, the precision of the liquid measurements suggests that your technique or equipment used for measuring the liquid was consistent and repeatable, resulting in closely clustered results.
Overall, combining accuracy and precision is essential for obtaining reliable and meaningful results in scientific experiments. Accurate measurements ensure that your data reflects the true value, while precise measurements indicate the consistency and reproducibility of your experimental technique. Both factors contribute to the quality and validity of your findings.
Method:
Write the method down and add diagram for Calibration
Interpretation of results
Which thermometer was accurate? Precise? Why?
Cooling Curve Practical
Method for Stearic Acid
- Put beaker with 200cm of water.
- Mount the beaker on a tripod and heat the water to boiling over the Bunsen burner.
- Control the Bunsen flame to maintain a constant temperature.
- Pour stearic acid into one-fourth of the boiling tube.
- Arrange the apparatus as shown in the diagram, making sure the thermometer is not in contact with the boiling tube's bottom or side.
- a temperature records.
- Take the boiling tube out of the hot water and keep track of the stearic temperature.
- Create a table with the results.
Identify chemicals associated with COSHH.
Labelled Diagram (reference if using a generic one, and ensure labels reflect chemicals used)
Make sure you include:
- names of chemical reagents
- the mass and volumes of substances used
- size of equipment
Results
Stearic acid is a fatty acid that undergoes combustion when heated. Combustion is an exothermic process, meaning it releases energy in the form of heat. When you added stearic acid to the system, it likely reacted with the surrounding oxygen, leading to combustion and the subsequent release of heat.
The fact that I have observed an increase in temperature confirms that the reaction between stearic acid and oxygen occurred successfully. This temperature increase is an indication that the reaction was exothermic and released energy in the form of heat. It validates that you followed the correct procedure, maintained appropriate conditions, and had all the necessary components in place. On the other hand, if I had observed a decrease in temperature or no significant change, it could have suggested a lack of proper combustion or some other issue with the experimental setup. This could have indicated potential errors or deviations from the expected behaviour.
The increase in temperature I observed demonstrates that the experiment was carried out correctly, allowing you to obtain meaningful results. It indicates that the stearic acid reacted as expected and produced the desired outcome of an exothermic reaction. This outcome supports the validity of my experimental procedure and enhances the reliability of your data.
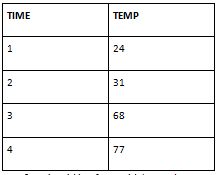
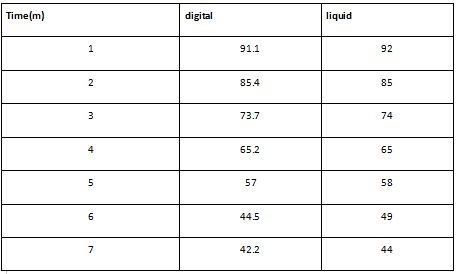
My peers table
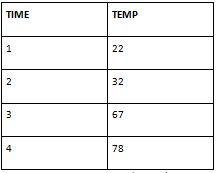
At the initial time point (Time 1), Set 1 recorded a temperature of 24, while Set 2 recorded 22. This small temperature difference could be attributed to variations in the experimental setup, initial conditions, or measurement errors.
As time progresses, both sets generally exhibit a similar pattern of increasing temperatures, indicating that heat is being released due to the combustion of stearic acid. At Time 2, Set 2 records a slightly higher temperature (32) compared to Set 1 (31), which again could be due to experimental variations or measurement errors.
At Time 3, both sets record temperatures near each other: 68 for Set 1 and 67 for Set 2. This suggests that the combustion process is proceeding similarly in both cases.
At the final time point (Time 4), Set 2 records a temperature of 78, slightly higher than Set 1's temperature of 77. Again, this difference could be due to experimental variability or measurement inaccuracies.
Considering calorimetry experiment with stearic acid combustion, the overall trend of increasing temperatures aligns with expectations for an exothermic reaction. The minor differences in temperature readings between the two sets may reflect the inherent variability and uncertainties associated with experimental measurements.
To obtain more reliable and accurate results, it is important to minimize sources of error, ensure precise temperature measurements, and repeat the experiment multiple times to observe consistent trends. Additionally, controlling variables such as the amount of stearic acid, oxygen supply, and insulation of the calorimeter can help improve the precision and reproducibility of the data.
Graph
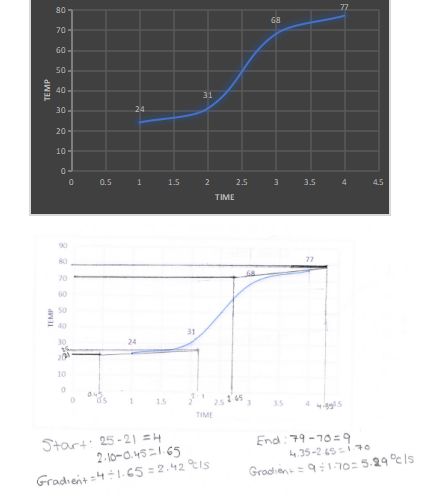
As you can see, I have drawn my tangents and using the tangent it helped me calculate my gradient
Start: 25-21=4 End:79-70=9
2.10-0.45=1.65 4.35-2.65=1.70
Gradient=4/1.65=2.42oc/s Gradient=9/1.70=5.29oc/s
COOLING CURVE OF Paraffin Wax
Method for Paraffin wax
Paraffin wax experiment
Equipment
Glass Beaker: The glass beaker is a cylindrical container made of glass with a flat bottom and straight sides. It is commonly used in laboratory experiments for holding liquids, mixing solutions, or conducting reactions. The beaker should have clear markings on the side to indicate volume measurements.
Test Tube: A test tube is a small, narrow, cylindrical tube made of glass or plastic. It is typically used for holding small amounts of liquids or conducting small-scale reactions. Test tubes come in various sizes, and they often have a rounded bottom. They can be heated directly over a flame or placed in a test tube holder during experiments.
Ice: Ice is solid water in the form of frozen crystals. It is used in experiments to provide a cold environment or to cool down substances. For the paraffin wax experiment, ice is used to create a cooling bath or to control the temperature during the solidification process.
Friends results
Equipment list
Identify chemicals associated with COSHH.
Labelled Diagram (reference if using a generic one, and ensure labels reflect chemicals used)
- Make sure you include:
- names of chemical reagents
- the mass and volumes of substances used
- size of equipment
Results
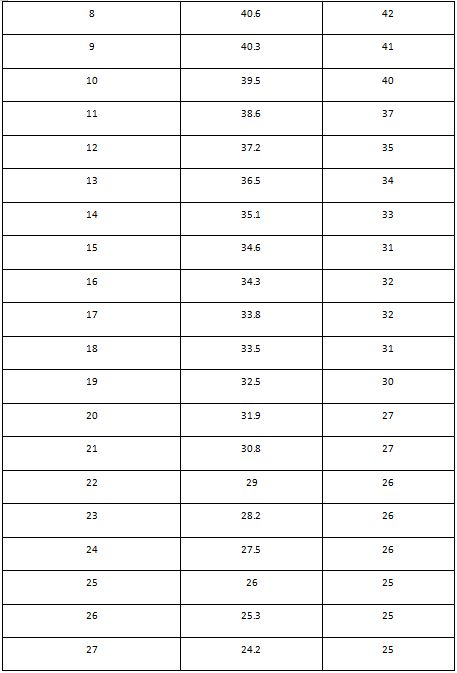
Table- Add your table and the one of your friend
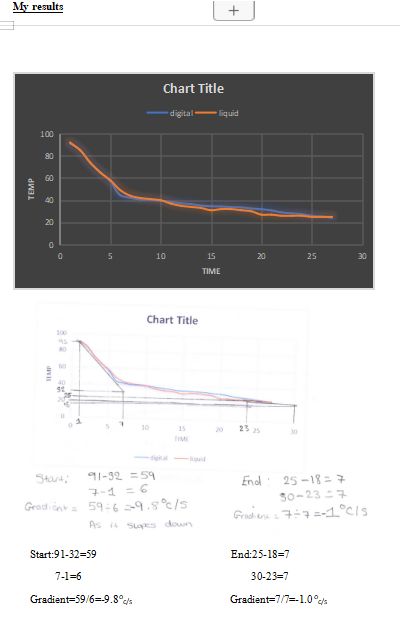
Graph
- Plot data and draw line of best fit. (Already drawn)
- P4: Draw starting tangent and calculate gradient (show your working). needs to be hand drawn
- M2: Draw end tangent and tangents at significant points to calculate gradient (show your working).
- M2: Use your calculations to draw conclusions about your graph. Calculations
Analysis
Part B.P4 Calculations of rate of cooling of second substances. Criterion can be awarded for this and work on stearic acid.
Part B.M2 appropriate points chosen for calculations of rate Part B.M2 Data analysed and conclusion drawn about rate of cooling at different Points
Write about phase change liquid- solid, solid-liquid
Analysis how the rate of cooling is related to intermolecular forces and the state of the substances.
Include molecular structure, Properties of state- relate this to your graphs.
.The cooling curve for stearic acid started.... (What type of line of best fit/curve...was it smooth or rough or all over the place?)
When did it plateau? Why?
After a while the temperature started to drop again and the graph showed another downward curve? Why?
Relate this to phase changes, intermolecular bonds, energy
The gradient of the graph of the cooling of stearic acid was .........at the start which means that the stearic acid was cooling at a rate of ............ every second.
When the stearic acid was changing state the gradient of the graph was .............which means ..... After the stearic acid had changed into a solid the gradient of the graph was ........ Which means that the stearic acid was cooling at a rate of......... every second and the rate of cooling had decreased.
The shape of the cooling curve for paraffin wax compared to stearic acid?
SAME AS FOR STEARIC ACID
Why was it slightly different?
Evaluation
Evaluate the accuracy of your practical work in relation to the analysis of the cooling curves and the equipment and methods you used:
- Describe the patterns and trends seen
- Compare your results to published data and class values.
- Were there any known problems with carrying out your cooling curve experiment?
- How can you improve your method to reduce inaccuracies why?
- Dont forget to include health and safety implications.
Are you struggling to keep up with the demands of your academic journey? Don't worry, we've got your back! Exam Question Bank is your trusted partner in achieving academic excellence for all kind of technical and non-technical subjects.
Our comprehensive range of academic services is designed to cater to students at every level. Whether you're a high school student, a college undergraduate, or pursuing advanced studies, we have the expertise and resources to support you.
To connect with expert and ask your query click here Exam Question Bank
