MATH1003 Quantitative Methods With Economics Assignment
- Subject Code :
MATH1003
- Country :
Australia
Background information + Task Description
A clothing store sells made-to-order uniforms for a range of businesses. Uniforms are sold in prepackaged combinations of shirts, jackets, trousers or skirts, with each item featuring the logo or emblem of the business in question. The quantity of uniform combinations sold varies from one year to the next, depending on economic conditions.
The stores management team want to maintain revenue to ensure ongoing employment of staff. In bad years, management increases the price of each combination by $14. In good years, management decreases the price of each combination by $10 to try and encourage ongoing sales.
Your task is to write a report which outlines the clothing stores revenue:
- With baseline settings (before application of any price changes);
- With application of a $14 price increase (in bad years); and
- With application of a $10 price decrease (in good years).
The stores supply and demand functions are represented by the following equations:
- Demand equation:
- Supply equation: 2 + 7
- q is the number of combinations sold (in hundreds)
- p is the price of each combination in dollars.
- and b are coefficients to be chosen as per Step 1 below.
Your report is to be presented in 7 sections using the following structure:
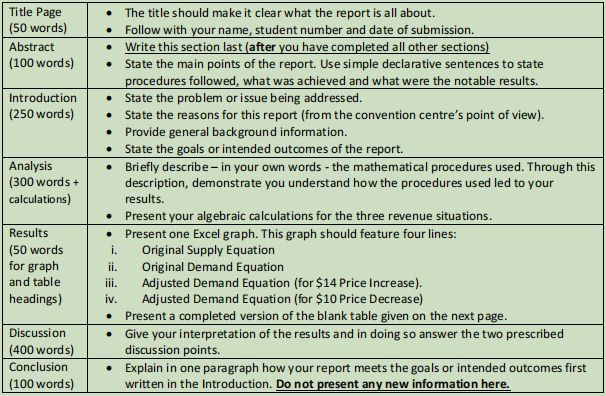
Steps required to complete the Analysis
You must describe the steps below in your own words and then present your calculations in the same order as these steps:
- Obtain two random numbers for a and b between 0.1 and 0.9 inclusive. Use the Excel random function =Rand() or the RANDOM key on your calculator.
- Find the equilibrium price and quantity algebraically, for baseline conditions (with no price change applied).
- Adjust the demand equation for a $14 price increase.
- Use algebra to find the new equilibrium price and quantity factoring in this $14 increase.
- Adjust the demand equation for a $10 price decrease.
- Use algebra to find the new equilibrium price and quantity factoring in this $10 decrease.
Steps required to complete the Results
- Use Excel to construct one graph, featuring 4 lines:
- Original Supply Equation
- Original Demand Equation
- Adjusted Demand Equation for $14 Price Increase (from Steps 2, 3 and 4)
- Adjusted Demand Equation for $10 Price Decrease (from Steps 5 and 6)
- Use your results to complete the following summary table. Round final answers in this table to two decimal places.
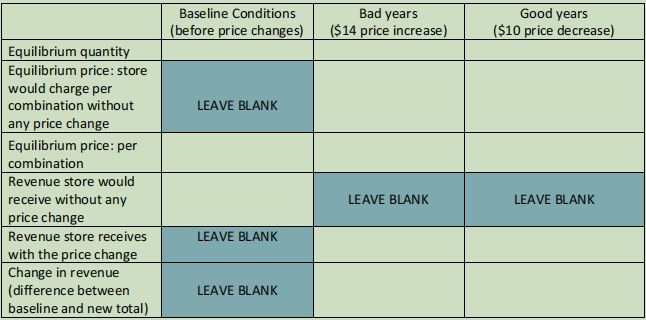
For the Discussion
Discuss the effect of each price change on equilibrium price, the price consumers pay for each combination, quantity and revenue. Comment on how much of each price change is actually passed onto customers and which of the two price changes gives the best result (i) for the store and (ii) for the consumer.
Are you struggling to keep up with the demands of your academic journey? Don't worry, we've got your back! Exam Question Bank is your trusted partner in achieving academic excellence for all kind of technical and non-technical subjects.
Our comprehensive range of academic services is designed to cater to students at every level. Whether you're a high school student, a college undergraduate, or pursuing advanced studies, we have the expertise and resources to support you.
To connect with expert and ask your query click here Exam Question Bank
