MPE 711 Global Trade And Markets Assignment
- Subject Code :
MPE-711
- University :
Deakin University Exam Question Bank is not sponsored or endorsed by this college or university.
- Country :
Australia
Question 1. (This question has two parts a, b and c)
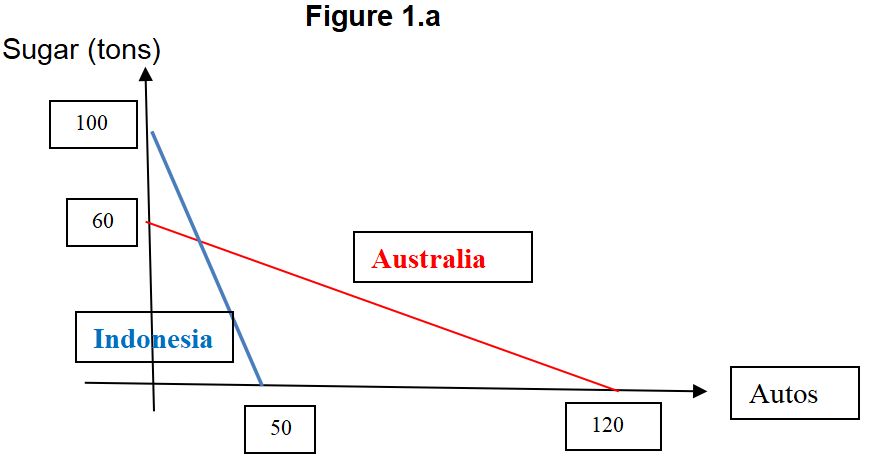
Assume that Australia and Indonesia have the same labor supply and their Production Possibility Frontiers/Schedules are presented below.
Figure 1.a below shows the Production Possibility Schedules of country A and country B.
Part (a)
Given the PPFs/PPSs of Australia and Indonesia in Figure 1.a, please identify the opportunity costs in the production of sugar (S) and cars (C) in Australia and Indonesia. According to Adam Smith what would be the patterns of trade between Australia and Indonesia? Please be elaborate in your answer. Please show the condition for the price of rice in terms of cars in free trade such that both counties gain from it.
Part (b)
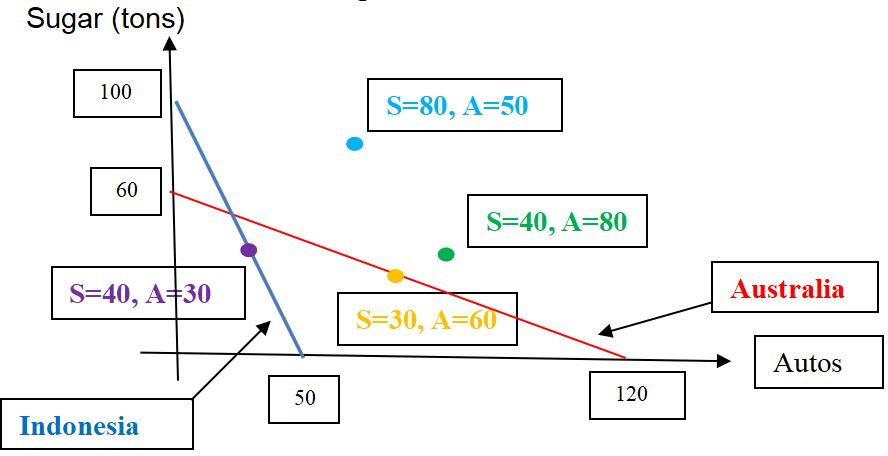
Assume now that in autarky, Indonesias optimal consumption point is 40 tons of sugar and 30 cars (i.e., at purple point) while in autarky Australias optimal consumption point is 30 tons of sugar and 60 cars (i.e, at yellow point). Please refer to Figure 1.b above. In autarky, these are the optimal consumption points because they correspond to the highest levels of utility for both countries.
Both countries are now allowed to trade with each other according to Ricardos principles of comparative advantage. Can Indonesia consume 80 tons of sugar and 50 cars (i.e., at blue point) by trading with Australia? Please precisely identify the price in free trade and the patterns of trade between the two countries in this case. In other words, in free trade, how many units of rice can sell for one car and how many units of rice Indonesia exports to (or imports from) Australia?
Part (c)M
Can Australia consume 40 tons of sugar and 80 cars (i.e., at green point) by trading with Indonesia? Please identify the price in free trade and the patterns of trade between the two countries in this case. Does the analysis allow us to say that both countries are better off in free trade than in autarky?
Question 2 (This question has two parts a and b)
You need to read Article 1 Australia has joined forces with Brazil and Guatemala taking on India in a sugar cane subsidy dispute to answer the questions below. The article is provided at the end of this examination document.
Part (a)
The article specifically mentions the following: Off the back of these subsidies India has ramped up its sugarcane production. In 2017-18 they produced 32.2 million tonnes of sugar and 30 million in 2018-19, compared to 20.3 million tonnes in 2016-17
To simplify the analysis, suppose that Australia trades with India only. Please use the concepts of supply of sugarcane and demand for sugarcane to explain why the Indian export subsidies have allowed Indias sugarcane production to increase in 2017-2018 and 2018-2019 compared to the period of 2016-2017.
Part (b)
Provide a welfare analysis of the impact of Indias export subsidies to its sugarcane farmers on Indias welfare and Australias welfare.
Hint: Use the concepts of supply and demand to illustrate the impact of Indias subsidies on consumers, farmers/producers, and government revenues of both countries.
Question 3 (This question has two parts: a and b)
You need to read Article 2 New Zealand wins WTO appeal over Australia apple ban to answer the questions below. Please find Article 2 at the end of this examination document.
Part (a)
Given the information in the article, use the concepts of the supply and demand for apples to illustrate the situation when Australias restrictions were in place.
Hint: you can assume that the world consists of two countries: Australia and New Zealand and the two countries can trade with each other.
Part (b)
Use the graphs in Part (a) to explain what happens to Australias market for apples after the WTOs appellate body largely upheld the findings of a panel of experts in August that condemned the restrictions. Compare Australias welfare in the presence of the restrictions on its apple imports and after these restrictions have been removed.
Question 4 (This question has two parts a and b)
Assume that the world consists of only two countries: A and B. Country As demand for rice and country As supply of rice have the following functions:
DA= 100-20P
SA= -20+20P
Country Bs demand for rice and country Bs supply of rice have the following functions:
DB=80-20P
SB=40+20P
where D, S, and P denote demand, supply, and the price in US$, respectively.
Part (a)
Given the information above, assume now that the government of the rice exporting country decides to apply a specific export subsidy of US$ 1 on its rice export.
Please graphically show that the effects of the specific export subsidy on the patterns of trade between the two countries in presence of the specific export subsidy.
Part (b)
Determine the effects of the specific export subsidy on the welfare of the rice exporting country. In other words, please compute the three components of the exporting countrys welfare in the absence and in the presence of an export subsidy.
Question 5. (This question has two parts a and b)
Part (a)
In 2020, the Australian foreign exchange at equilibrium is 0.50 British pound () per Australian dollar. What will happen to the Australian foreign exchange in the two following different and separate scenarios?
a.1.While in 2020, both Australia and the UK go through a period of recession, the recession in Australia is much worse than that in the UK. Please elaborate your answer using the concepts of the demand curve for Australian dollars and the supply of Australian dollars.
a.2. Following Brexit, the UK adopted a less protectionist trade policy vis--vis countries that are not members of EU.
Part (b)
The nominal exchange rates between the Australian dollar and the US dollar in 2019 and 2020 are as follows: 0.85 USD and 0.75 USD for 1 AUD, respectively. For the same period, the United States and Australia experience an inflation rate of 8% and 15% respectively. In other words, in 2020, the US and Australian consumer prices increase to a level 108 and 115, respectively. Does the Australian dollar appreciate or depreciate in real terms vis--vis the US dollar. Please be elaborate in your answer.
