Occupational Questionnaire Assignment
- Country :
Australia
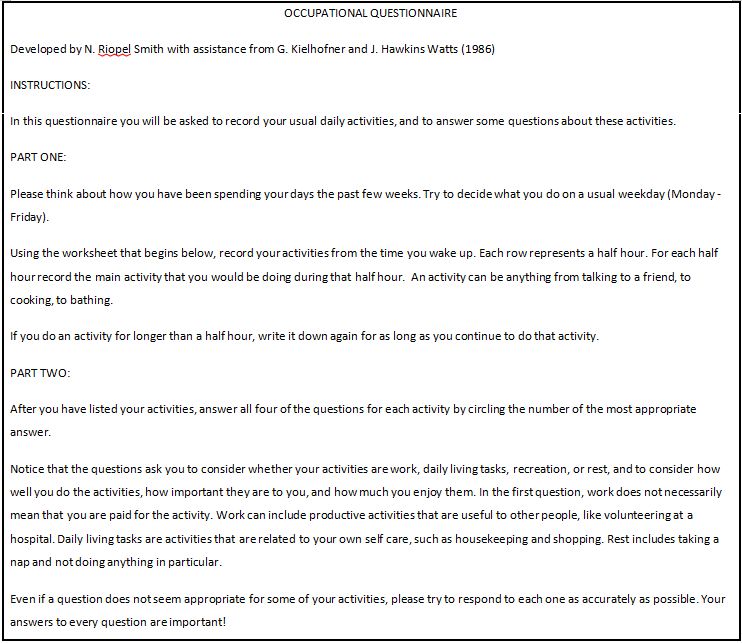
This Guide for Using the OQ provides instructions for administration, scoring and reporting. After scoring and analysis you will check back with the person who completed the OQ and ask them follow up questions to help make sense of the information gained. Read this in conjunction with the Assessment 1 Information.
Choosing a participant
You can invite anyone to complete the Occupational Questionnaire (OQ) but there are some factors you might want to consider. You may find the OQ more interesting to complete, analyse and discuss for someone who has a more interesting life. They may live with a particular health condition, be part of a particular community, be of a particular age range, be a carer, someone who has retired from work, an elite athlete, someone managing a chronic health condition, someone from a different culture to you, someone who negotiates many roles etc. Assign your person a respectful pseudonym to use in the assignment.
Completing the Occupational Questionnaire
Ask the person to complete the OQ as per the instructions on the first page. (see box below: excerpt from OQ). Remind them this is based on their time use on a typical day during the week averaged over the last few weeks.
You can ask your person to complete the OQ for a typical weekend day if that would be more relevant for their circumstances. Make note of this if this is the case. (In practice you could also look at both a weekday and weekend day if that makes sense for the individual and compare results.) For this assessment only do one.
Once they have completed the OQ and you have analyzed the results, you will need to conduct a follow up interview with them to gain more in-depth information, seek relevant clarifications and make sense of what the person has completed. The OQ needs to be analysed with the person who completed it held in mind. This follow up interview is best done in person or by phone.
Scoring and analysing
Calculate the results of the OQ and complete a Score Sheet. A blank version is provided for you as a separate document on FLO (OQ Score Sheet).
For Question 1
Calculate total time spent in each category in hours (Frequency)
- Work =
- Daily living=
- Recreation =
- Rest =
(To Calculate: Add up totals for each category then divide by 2 to get hours)
(38 time units ie 30minute sessions)
Calculate total percentage of time per category:
- Work Total =
- Daily living Total =
- Recreation Total =
- Rest Total =
(To Calculate: no. of hours divide by 19 x 100 = _____%)
For Questions 2, 3 & 4
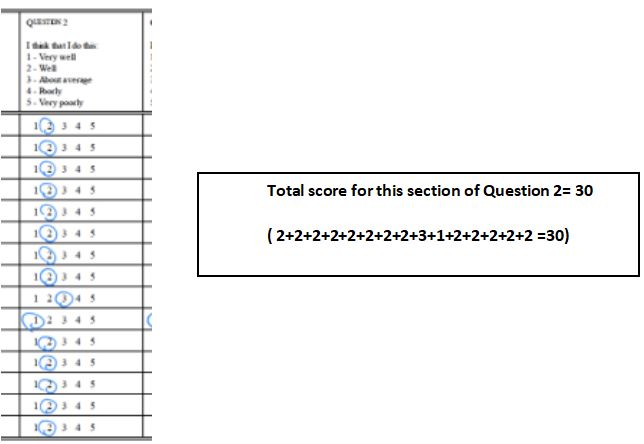
Calculate Overall Averages for each Volition sub section
- Personal causation (question 2)
- Values (question 3)
- Interest (question 4)
(Calculate this by adding up total values (sum of ratings) in each column and dividing by 38)
Eg
Tips for analyzing Personal causation (PC):
- Greatly influences an individuals perception and choice of occupation
- Reflects an individuals self-image, expectations of success, belief in their skills & efficacy of their skills, sense of competence
QUESTION 2
I think that I do this:
- Very well
- Well
- About average
- Poorly
- Very poorly
Overall average for PC: What does this overall average score tell you? On average this person is spending their time doing things they think they do [SELECT ONE OF THESE OPTIONS -very well, well, about average, poorly, very poorly]. The lower the score the greater the sense of competence.
Eg A score of 1.9 would tell you that on average this person is spending their time doing things that they think they do well.
Horizontal analysis: (checking against actual activity, type of activity, scores in interests and values and time)
Vertical Analysis (within each area of volition)
Calculate a % of time spent doing things in each category:
To do this you add up all the items in those categories then divide by 38 time units and multiply by 100 to get a percentage of time. Eg In the Personal Causation section you want to determine the proportion of time spent doing things the person perceives they do really well. You would add up all the 1s in this section, divide this number by 38 and multiply by 100. This will give you the percentage of time spent doing things that they perceive they do really well.
For example: Your analysis would include the following:
- What scored 4 or 5? Explore why
- Calculate a % of time spent doing things that scored 4 or 5
- What does that indicate about life satisfaction?
- Analyse patterns of time: when are these occurring, times of day
- What scored 1?
- Calculate a % of time spent doing things that scored 1
- What does that indicate about life satisfaction?
- Analyse patterns of time: when are these occurring, times of day
- Any other important considerations?
Tips for analyzing Values:
- greatly influence an individuals perception and choice of occupation
- reflects what is important, meaningful and valuable
- influenced by cultural background, socioeconomic status, age, gender, occupational or educational group, family membership and psychological state
QUESTION 3
For me this activity is:
- Extremely important
- Important
- Take it or leave it
- Rather not do it
- Total waste of time
Overall Average for Values: What does this overall average score tell you? On average this person is spending their time doing things they think are [SELECT ONE OF THESE OPTIONS -extremely important through to total waste of time]. The lower the score the greater the value and importance.
Eg A score of 4.3 would tell you that on average this person is spending their time doing things that they dont consider to be important.
Horizontal analysis: (checking against actual activity, type of activity, scores in interests and personal causation and time)
Vertical Analysis (within each area of volition)
Calculate a % of time spent doing things in each category:
To do this you add up all the items in those categories then divide by 38 time units and times by 100 to get a percentage of time. Eg To determine the proportion of time spent doing things the person perceives as lacking in value. You would add up all the 4s and 5s in the Values section, divide this number by 38 and multiply by 100. This will give you the percentage of time spent doing things that they perceive as lacking in value.
For example: Your analysis would include the following:
- What scored 4 or 5? Explore why.
- Calculate a % of time spent doing things that scored 4 or 5
- What does that indicate about life satisfaction?
- Analyse patterns of time: when are these occurring, times of day
- What scored 1 or 2?
- Calculate a % of time spent doing things that scored 1 or 2?
- What does that indicate about life satisfaction?
- Analyse patterns of time: when are these occurring, times of day
- Any other important considerations?
Tips for analyzing Interests:
- personal disposition to find pleasure in objects, events or people that lead to the individual initiating or maintaining involvement in certain occupations
QUESTION 4
How much do you enjoy this activity:
- Like it very much
- Like it
- Neither like it nor dislike it
- Dislike it
- Strongly dislike it
Overall Average for Interests: What does this overall average score tell you? On average this person is spending their time doing things they [SELECT ONE OF THESE OPTIONS like very much through to strongly dislike]. The lower the score the greater the enjoyment.
Horizontal analysis: (checking against actual activity, type of activity, scores in values and personal causation and time)
Vertical Analysis (within each area of volition)
Calculate a % of time spent doing things in each category:
To do this you add up all the items in those categories then divide by 38 time units and times by 100 to get a percentage of time. Eg In the Interests section you want to determine the proportion of time spent doing things the person strongly dislikes. You would add up all 5s in the Interests section, divide this number by 38 and multiply by 100. This will give you the percentage of time spent doing things that they strongly dislike.
For example, your analysis would include the following:
- What scored 4 or 5? Explore why.
- Calculate a % of time spent doing things that scored 4 or 5
- What does that indicate about satisfaction?
- Analyse patterns of time: when are these occurring, times of day
- What scored 1?
- Calculate a % of time spent doing things that scored 1
- What does that indicate about satisfaction?
- Analyse patterns of time: when are these occurring, times of day
- Any other important considerations?
How satisfied is the person with particular activities?
Calculate total satisfaction score:
Add up averages for columns 2, 3, & 4 and divide by 3
(OR add up all the scored items in columns 2,3,4 and divide by 114)
Total Scores of Satisfaction:
- Reflects overall satisfaction levels with occupational engagement.
Satisfaction Rating Scale
1 = very satisfactory
2 = satisfactory
3 = neither satisfactory nor unsatisfactory
4 = unsatisfactory
5 = very unsatisfactory
As this is not a precise measurement tool, state the exact scoreand then round it down or up to fit within the appropriate satisfaction levels state.
egThis person scored 2.29 which fits in with an overall satisfaction rating of 2 indicating they are satisfied with their occupational engagement.
Follow up Discussion
Check for congruence to explore and explain any outliers with the individual. Also consider the relationship of satisfaction with the time of day and the type of activity. Check for frequency and discuss how often they do things they really enjoy? they really think are a waste of time etc? Are there any patterns you can identify?
Keep a summary of your questions and the answers provided to submit with your assignment. This does not have to be a formal transcript. Handwritten notes are acceptable as long as they are legible.
Reporting
Analyse the findings from the OQ. The key is to analyzing the information is in the context of the individual completing the OQ. Not all sections may be relevant for each individual. Keep in mind what does this information mean in regard to their time use, occupational balance and satisfaction? What is relevant to report on?
Complete the OQ score sheet and then complete the OQ Summary of Results.
Summarize your findings in report form following the template in the document Assessment 1 Information.
Are you struggling to keep up with the demands of your academic journey? Don't worry, we've got your back! Exam Question Bank is your trusted partner in achieving academic excellence for all kind of technical and non-technical subjects.
Our comprehensive range of academic services is designed to cater to students at every level. Whether you're a high school student, a college undergraduate, or pursuing advanced studies, we have the expertise and resources to support you.
To connect with expert and ask your query click here Exam Question Bank
