Predictive Analytics and Machine Learning for Customer Churn in Telecommunications DSAI4023
- Subject Code :
DSAI4023
1. Introduction
The main objective of this project is to analyse the provided wireless telecommunications datasets with the help of Python programming. This analysis is used to predict customer churn, roll out solutions to their customers facing problems in the call centers, and also establish the target customer profile that will implement a proactive churn management program for the telecommunication company. and this analysis prediction will involve the data manipulation, data cleaning, statistical modelling, and interpretation of the results and conclusions. In addition, this analysis will identify the 3000 customers that are most likely to churn with the help evaluation dataset. These will be analysed and discussed in detail.
2. Data Manipulation, Cleaning, and Descriptive Analysis
To start with, clean and manipulate the provided datasets to predicting the customer churns by follow the below steps.
Firstly, Import the required packages. And import the provided training dataset and evaluation dataset on Python as demonstrated below.
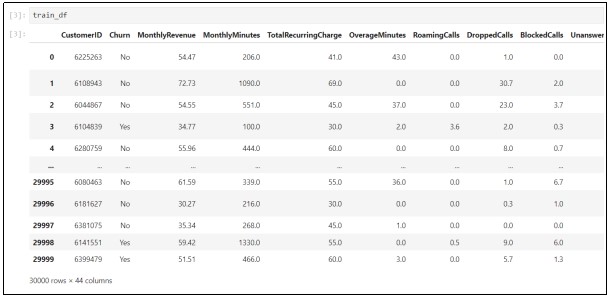
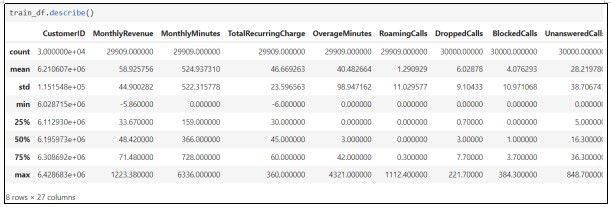
The training dataset consists of 30000 rows of observations and 44 columns. Next, describe the training dataset that will provide the basic statistical information about the variables as demonstrated below.
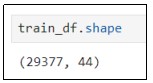
Next, Checking the missing values in the training dataset. As per the result, we can clearly see that there are missing values in our training dataset. We have to remove the identified missing values with the help of the dropna function. After that, we have 29377 rows of observations and 44 columns in our training dataset, as demonstrated below.
Now, our training dataset is cleaned. Next, we have to import the evaluation dataset as demonstrated below.
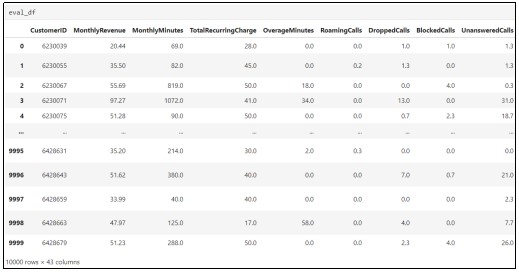
After, checking the missing values in our evaluation dataset. As per the result, we can clearly see that there are missing values in our evaluation dataset. We have to remove the identified missing values with the help of the dropna function. Next, explore the target variables in our training dataset as demonstrated below.
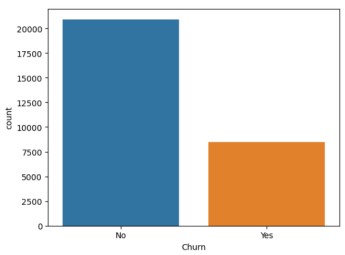
According to the above result, we can clearly see that more than 20000 customers are not interested in churning and 7500 customers are most likely to churn in a telecommunications company. After that, we are going to manipulate the training dataset with the help of the label encoder and standard scaler function. Then, set the target variable as churn, and other variables are feature variables. Next, split the dataset into training data as 70% and test data as 30%. After, encode the categorical features with the help of the encoder and scaler functions, as demonstrated below.

At last, our training dataset is cleaning and manipulated for developing a machine learning model to predicting the churns.
3. Machine Learning Modeling
Now, we are going to build a machine learning models to predicting the customer churns. The selected machine learning models are discussed in below.
3.1 Logistic Regression
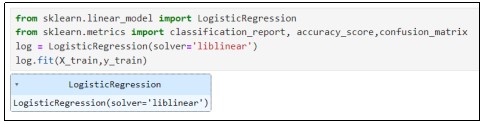
To start with, build a logistic regression model with the help of the Sklearn linear model library. And set the solver as liblinear. This function will effectively predict the categorical target variables, which are churn or no churn. The created logistic regression model as demonstrated below.
Next, predict on the test dataset and evaluate the created logistic regression model by determining the accuracy score as demonstrated below.

After that, see the confusion matrix for the created logistic regression model that will predict how many customers are most likely to churn or not churn as demonstrated below.

3.2 Decision Tree
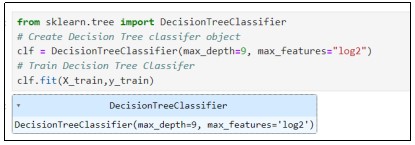
Next, build a decision tree model with the help of the Sklearn tree library. And set the parameters such as maximum depth as 9, and maximum features as log2. This function will effectively predict the categorical target variables, which are churn or no churn. The created decision tree model as demonstrated below.
Next, predict on the test dataset and evaluate the created decision tree model by determining the accuracy score as demonstrated below.

After that, create a confusion matrix for the created decision tree model that will predict how many customers are most likely to churn or not churn as demonstrated below.

3.3 Random Forest
After, build a random forest model with the help of the Sklearn ensemble library. And set the parameters such as maximum depth as 9, number of estimators as 25, and maximum features as log2. This function will effectively predict the categorical target variables, which are churn or no churn. The created random forest model as demonstrated below.

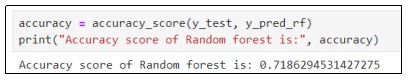
Next, predict on the test dataset and evaluate the created random forest model by determining the accuracy score as demonstrated below.
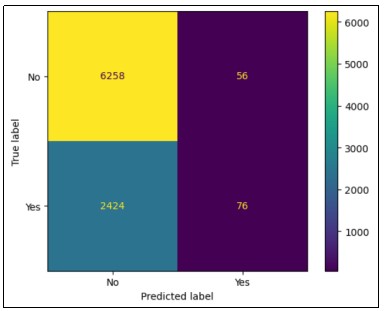
After that, create a confusion matrix for the created random forest model that will predict how many customers are most likely to churn or not churn as demonstrated below.
3.4Multilayer Perceptron Network
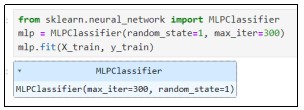
Lastly, build a MLP with the help of the Sklearn neural network library. And set the parameters such as random state as 1, and maximum number of iterations as 300. This function will effectively predict the categorical target variables, which are churn or no churn. The created MLP model as demonstrated below.
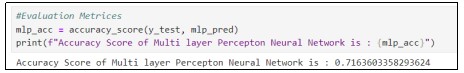
Next, predict on the test dataset and evaluate the created MLP model by determining the accuracy score as demonstrated below.
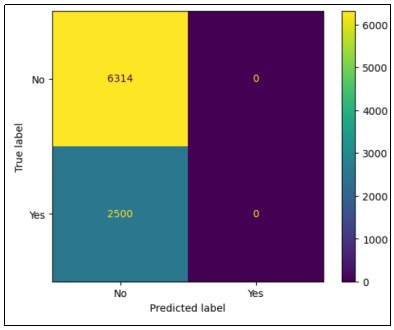
After that, create a confusion matrix for the created MLP model that will predict how many customers are most likely to churn or not churn as demonstrated below.
3.5 Evaluation Dataset Analysis to Identify 3000 customers
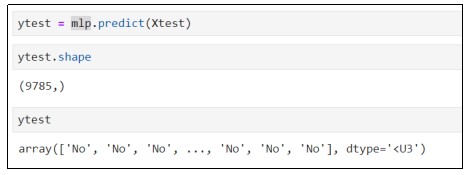
In addition, we are going to identify the 3000 customers from the evaluation dataset. We already imported and cleaned the evaluation dataset on a Python notebook. To identify the 3000 customers, we have to determine and add the churn variable in the evaluation dataset with the help of the training dataset. To determine this, we can use the x_train and y_train from the training dataset and consider the X_test as a cleaned evaluation dataset. then predicting the Y_test, that is, the target variable for the evaluation dataset, with the help of the above-created machine learning models. In this case, we used the MLP model to predict the churn variable for the evaluation dataset, as demonstrated below (Subasi, 2020).
According to the above result, determine the churn variable for the evaluation dataset. Next, we have to add the determined churn variable to the evaluation dataset. After that, determine which 3000 customers are most likely to churn and then create a new CSV format with a customer ID of 3000 customers, as demonstrated below.

4. Interpretation of Results and Findings
Here, we are going to interpret the created machine learning models to predict the customer churns. As per the logistic regression result, the created logistic regression model has 71.63?curacy for predicting the customer churns. And evaluate this model by seeing the confusion matrix. Based on the confusion matrix, we can clearly see that 6314 customers are not interested in churning. Simultaneously, 2500 customers show the highest likelihood of churning.
As per the decision tree result, the created decision tree has 71.02?curacy for predicting the customer churns. And evaluate this model by seeing the confusion matrix. Based on the confusion matrix, we can clearly see that 6056 customers are not interested in churning. Simultaneously, 2296 customers show the highest likelihood of churning.
As per the random forest result, the created random forest has 71.86?curacy for predicting the customer churns. And evaluate this model by seeing the confusion matrix. Based on the confusion matrix, we can clearly see that 6258 customers are not interested in churning. Simultaneously, 2424 customers show the highest likelihood of churning.
As per the MLP result, the created random forest has 71.63?curacy for predicting the customer churns. And evaluate this model by seeing the confusion matrix. Based on the confusion matrix, we can clearly see that 6314 customers are not interested in churning. Simultaneously, 2500 customers show the highest likelihood of churning (How to reduce churn rate in telecom? best practices. 2024).
Next, we have to compare the created machine learning models to determine the best model for churn predictions. According to the above result, we can clearly see that random forest model have high accuracy compared with other models. Therefore, random forest model is best fit model for this prediction. So, we can conclude that, 6258 customers are not interested in churning. Simultaneously, 2424 customers show the highest likelihood of churning.
5. Recommendations and Discussion
This project effectively predicted the customer churn for a telecommunications company with the help of the machine learning models. We already determined that the random forest model is the best fit model for this prediction. And this model predicted that 6258 customers are not interested in churning. Simultaneously, 2424 customers show the highest likelihood of churning. And, also, we are effectively predicted that 3000 customers are most likely to churn based on the evaluation dataset. I recommended that to reduce the customer churns in the telecommunications industry, we have to follow the below steps.
- Improve customer retention
- priorities network quality
- Billing transparency
- Customer service excellence.
Are you struggling to keep up with the demands of your academic journey? Don't worry, we've got your back!
Exam Question Bank is your trusted partner in achieving academic excellence for all kind of technical and non-technical subjects. Our comprehensive range of academic services is designed to cater to students at every level. Whether you're a high school student, a college undergraduate, or pursuing advanced studies, we have the expertise and resources to support you.
To connect with expert and ask your query click here Exam Question Bank
