Statistical Methods in Health Intervention Analysis BSTA4031
- Subject Code :
BSTA4031
Question 1
Part (a)
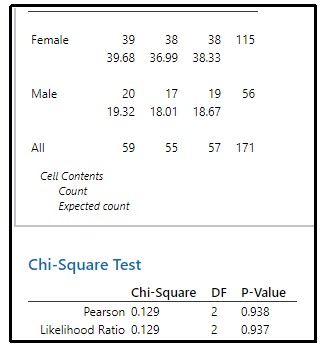
Figure 1: Chi-square test for gender and intervention
(Source: Minitab)
Chi-square test value in the analysis is read as 0.129 and the degree of freedom is derived as 2. The statistical significance relation between gender and intervention, p-value is compared which commonly ensures a significance level of 0.05. P-value in this analysis is calculated as 0.938 which is much greater than 0.05. So, it is recognized that there is no statically significant relationship between gender and interventions and the distribution of interventions does not significantly vary by gender.
Part (b)
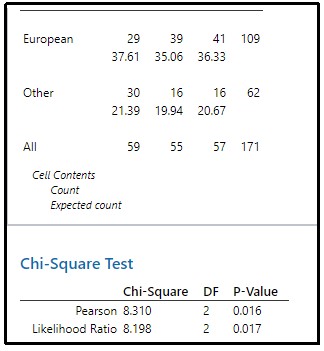
Figure 2: Chi-square test for ancestry and intervention
(Source: Minitab)
The value of chi-square test for ancestry and intervention is calculated as 8.310 and the degree of freedom is read as 2 expected for two groups of interventions. The p-value is read as 0.016 which is very less than 0.05. As per the p-value, an efficient and statistical relationship between Ancestry and Intervention is reflected based on the result of the chi-square test. This indicates that intervention groups vary significantly according to the ancestry of the individuals.
Part (c)
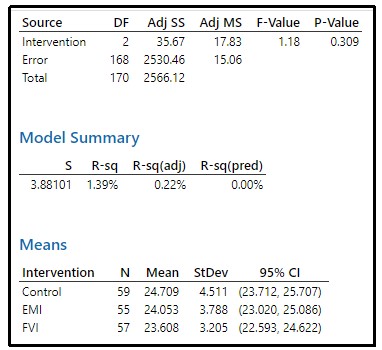
Figure 3: One-way ANOVA test for BMI and intervention
(Source: Minitab)
Statistical significance between BMI and intervention groups is analyzed by performing the One-way ANOVA test. The p-value is calculated as 0.309 which is quite greater than 0.05 and the F-value is read as 1.18. As per the p-value, there is no statistical significance in the mean of BMI and intervention groups such as Control, EMI, and FVI. The mean of each intervention group such as Control is calculated as 27.709, EMI as 24.053, and FVI as 23.608.
Question 2
Part (a)

Figure 4: Box plot of average daily food consumption with intervention
(Source: Minitab)
Boxplot visualizing daily fruit and vegetable consumption across intervention groups. This indicates that the intervention significantly increased average consumption compared to the control group. The median daily fruit and vegetable composition in the intervention group such as control is placed in between 2 to 3 and EMI is placed between the region of 3 to 4.5. The spread of values in the intervention groups suggests a more consistent intake among participants, which indicates a successful intervention to encourage healthy dietary habits.
Part (b)
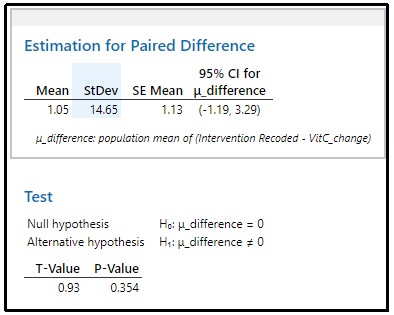
Figure 5: Paired T-test for intervention and vitamin C change
(Source: Minitab)
Paired T-test for intervention and vitamin C change is performed to investigate the plasma test and increase in vitamin C. The p-value is calculated as 0.354 which is greater than 0.05 and fails to reflect the null hypothesis. No statistically significant evidence is found to suggest the intervention wthat increase in plasma vitamin C levels. The confidence interval for the mean difference of -1.19, 3.29 further states that there is no significant effect on vitamin C levels. Mean difference of 1.05 suggests there may be an increase in Vitamin C levels, but large values of standard deviation and p-value suggest that this result is not statistically significant.
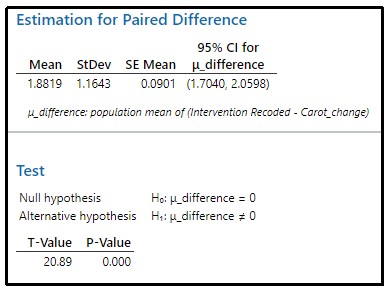
Figure 6: Paired T-test for intervention and vitamin carrot change
(Source: Minitab)
Statistical significance of the increase in total plasma carotenoid by intervention is analyzed by performing a T-test on the provided dataset. No p-value is provided by this analysis and T-value is read as 20.89 which is greater than zero, so there is no relation between the intervention and vitamin carrot change. Mean difference of 1.8819 shows a confidence interval that does not include zero and significant change indicated on total plasma carotenoid levels. The confidence interval does not include zero and given the T-value which significantly indicates the intervention result is a statistically significant increase in plasma carotenoid levels.
Question 3
Part (a)
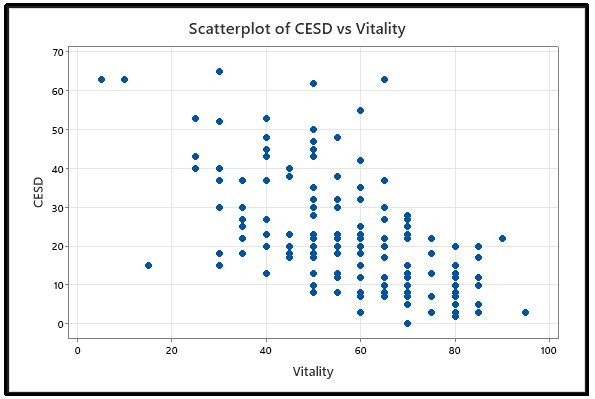
Figure 7: Scatterplot of Vitality and CESD
(Source: Minitab)
Scatterplot of vitality and CESD is visualized in the analysis performed in Minitab software. Maximum density of vitality is visualized in the region of 40 to 80 in vitality and 0 to 40 in the region of CESD of the scatterplot.
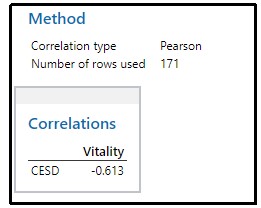
Figure 8: Correlation of Vitality and CESD
(Source: Minitab)
Relationship between CESD and vitality is analyzed by performing the person-type correlation analysis. The correlation coefficient is read as -0.613 and it states that there is a linear relationship appears between CESD and Vitality. The relationship is negative as indicated by the negative sign of the correlation coefficient which is -0.613. This states as the vitality score increases, CESD score tends to decrease and vice versa. With r = -0.613, it suggests that this relationship falls in the range of moderate to strong and makes a reasonably consistent inverse relationship between vitality and CESD. This makes sense to fit a linear regression model in this study because the correlation coefficient indicates a linear relationship by suggesting a linear model that could be an effective trend between the two variables. The moderate to strong negative correlation shows that the changes in vitality could help to predict changes in CESD. Linear regression model may be very useful for predicting CESD scores as per vitality scores.
Part (b)
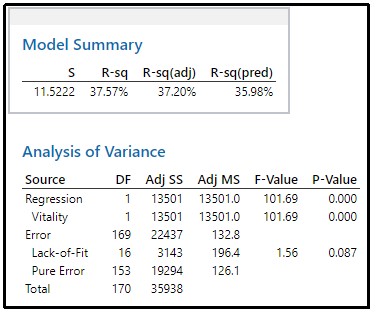
Figure 9: Regression analysis of Vitality and CESD
(Source: Minitab)
Linear regression analysis of vitality and CESD is performed on the given dataset in Minitab software. Model summary table and analysis of variance table are shown in the figure. R-square value, R-squared adj value, p-value, f-value, and so on are described in this analysis.
Part (c)
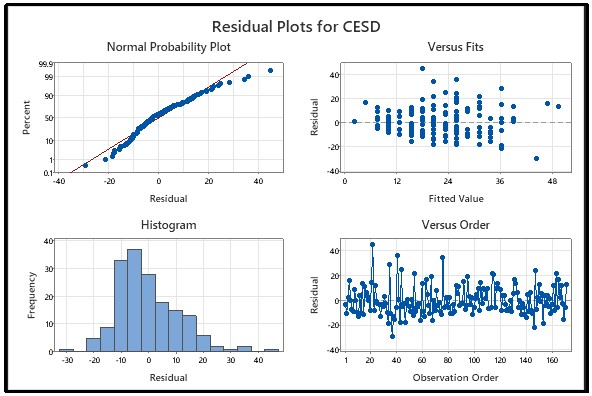
Figure 10: Residual plots for CESD
(Source: Minitab)
The scatterplot of vitality and CESD shows a linear trend without any distinct patterns or curves. Regression value of the negative coefficient for vitality also suggests a linear relationship with an increase in vitality is associated with a decrease in CESD. Independence is also satisfied for the analysis with a study design of random sampling. Observations are independent of each other which means the residuals should not be correlated. The residuals associated with the histogram plot show that the residuals are approximately normally distributed. As per residual versus fitted value plot, it shows a scatter without any increasing or decreasing spread. The F-value for lack of fit is 1.56 approximately with a p-value of 0.087, which suggests no significant lack of fit. So, it can be stated that equal standard deviations are perfectly satisfied.
Part (d)
The strength of relationship between CESD and vitality can be assessed or measured by using the coefficient of determination which is an R-squared value, calculated in linear regression model. Value of R-squared is calculated as 37.57% and the adjusted R-squared is calculated as 37.20%. The R-squared value indicates that 37.57% of the variability in CESD scores can be explained with the help of the vitality score of the model. It also suggests a moderate strength of relation between vitality and CESD. This relation is statistically significant and other factors are not able to influence CESD score.
Part (e)

Figure 11: Regression analysis of Vitality and CESD with coefficients
(Source: Minitab)
The estimated slope is a type of slope that indicates the change in the CESD score for one unit increment of vitality. Every increment of 1 point increase in vitality, the CESD score is estimated to decrease by 0.5277 points as per the coefficient slope of -0.5277. This negative slope shows an inverse relationship between vitality and CESD. This slop helps to quantify the relationship and highlights the role of vitality as a predictor for depression levels.
Part (f)
The linear regression model suggests concrete evidence by indicating that the relationship between CESD and vitality is statistically significant at the significance level of 5%. This represents that vitality is a crucial predictor of CESD scores. Changes implemented in vitality lead to changes in CESD. The estimated slope is calculated as -0.5277 and standard error slope is read as 0.0522 with a t-value of -10.81. These negative slopes denote an inverse relationship between vitality and CESD.
Question 4
Part (a)
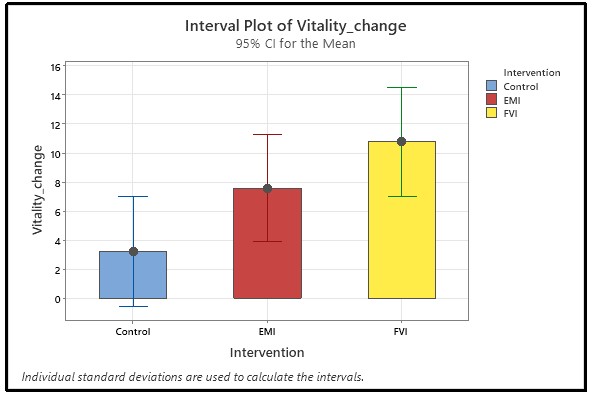
Figure 12: Error bar diagram of vitality change by intervention change
(Source: Minitab)
This error bar diagram visualizes three groups such as control, EMI, and FVI with mean change for each group by the central point of each interval. The error bars indicate that the different groups have significantly different mean changes. Mean change in vitality score for control group is lower compared to the other groups. EMI shows a relatively higher mean change in vitality score. This plot provides visually assesses differences in the effectiveness of each intervention. 95% of confidence interval for control and EMI overlap indicates no statistically significant difference in vitality change between the groups.
Part (b)
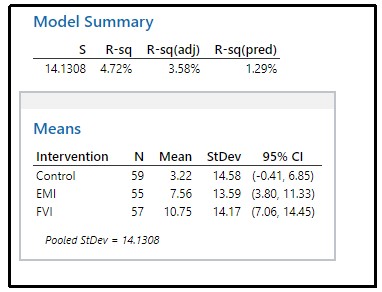
Figure 13: One-way ANOVA test on vitality_change and intervention
(Source: Minitab)
One-way ANOVA test is performed to determine the significant difference in the mean change in vitality score among different intervention groups. P-value is read as 0.017 which is less than 0.05, therefore it rejects the null hypothesis. This reflects a significant statistical difference in the mean change in vitality scores between a pair of intervention groups at 5% significance level. According to the ANOVA test, all groups do not have the same mean change in vitality scores.
Report
Brief Summary
This project aims to evaluate the effectiveness of different interventions such as control, EMI, and FVI on the basis of participants health outcomes. These health outcomes include vitality scores, plasma vitamin C levels as well as carotenoid levels. Statistical analysis is used to determine the difference between the intervention groups to explore relationships between key variables such as vitality and CESD scores. Different hypothesis tests are performed including Chi-square tests and ANOVA tests. The interventions of varying effects on the different health outcomes are studied. Negative relationship between vitality and CESD scores suggests the link between improved vitality and better mental health outcomes.
Methods
This study includes 171 participants of both male and female participants were involved. Data were collected through baseline and follow-up assessments including plasma biomarker measurements such as vitamin C and carotenoids, vitality score, and BMI. Participants provided fasting blood samples to assess nutrient levels, while self-reported questionnaires were used to capture changes in vitality and CESD scores, ensuring a comprehensive view of the health impacts of dietary modifications. Variables analyzed include vitality scores, CESD design, vitamin C levels, and carotenoid levels. Vitality scores were measured before and after interventions to evaluate the impact of dietary changes on participants' overall vitality. CESD score measures depressive symptoms by allowing examinations of the relationship between mental health and vitality. Several statistical methods and graphical displays are provided in this analysis. Chi-square test, ANOVA test, paired t-tests, correlation analysis, and linear regression are performed in this analysis. Graphical techniques such as box plots, scatter plots, and error bar diagrams are performed to visualize the data.
Results
Chi-square test for ancestry and intervention is performed for ancestry and intervention and p-value is read as 0.016. Gender and intervention of chi-square test is performed with a p-value of 0.938. Paired t-test is performed on intervention and vitamin C change where the p-value is read as s0.354 and the t-value is read as 0.93. The mean is calculated as 1.05 and the standard deviation is read as 14.65. Paired test for intervention and vitamin carrot change is performed with a p-value of 0 and a t-value of 20.89. The correlation is performed where vitality and CESD are measured as -0.613 with 171 number of persons. Regression analysis is performed to analyze vitality and CESD with a p-value of 0.087.
Discussion
The study aims to assess the effects of different dietary interventions such as controls, EMI, and FVI groups. The analysis results indicate the FVI group to a significant increase in plasma vitamin C and carotenoid levels by suggesting the intervention effectively promoted greater consumption of fruits and vegetables. EMI group of participants shows improvement in these biomarkers, although to an extent of FVI group. The analysis revealed notable changes in participants of vitality scores particularly among the group of FVI. the purpose of the study aligned to explore the dietary changes that influence physical and mental health. The resulting advice more fruits and vegetables into ones diet which may lead to tangible benefits in vitality. The study had a significant gender imbalance with two-third of participants being female. This could skew the result and limit the applicability of the findings.
Intervention period of this study is not long enough to capture the full impact of dietary changes on the outcome of health. Detailed and elaborate study allows researchers to assess sustained behavior changes and long-term effects on well-being. There is a huge possibility that participants' self-reported data on their dietary habits and vitality could be biased as individuals did not calculate or measure consumption data accurately. Future studies could implement more precise and objective measures to monitor dietary habits as well as physical activity. This will provide a more accurate assessment of the relationship between diet and health outcomes.
Conclusion
Increasing the intake of fruits and vegetables can improve health outcomes, and addressing the identified shortcomings in future research will help to strengthen the findings and ensure a wider audience or individuals. Enhancing the diversity of participants, the duration of interventions, and using more critical measures of dietary intake, future studies can provide deeper insights into the relationship between diet and the health of individuals.
Are you struggling to keep up with the demands of your academic journey? Don't worry, we've got your back!
Exam Question Bank is your trusted partner in achieving academic excellence for all kind of technical and non-technical subjects. Our comprehensive range of academic services is designed to cater to students at every level. Whether you're a high school student, a college undergraduate, or pursuing advanced studies, we have the expertise and resources to support you.
To connect with expert and ask your query click here Exam Question Bank
