SUMMATIVE Coursework Assessment Brief [CW2]
- SUMMATIVE Assessment Brief
2.1. Assessment learning outcomes
This assessment is designed to gauge your understanding, skills and application of common data
analysis techniques used in business and other organisations today. As such you need to
demonstrate your attainment in these areas according to the THREE Module Learning Outcomes
(LOs):
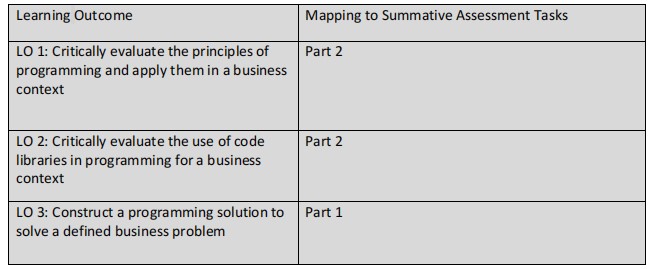
LO 1: Critically evaluate the principles of programming and apply them in a business context.
LO 2: Critically evaluate the use of code libraries in programming for a business context.
LO 3: Construct a programming solution to solve a defined business problem.
2.2. Assessment tasks
This assessment is made up of TWO Parts
Part 1 - a coding exercise in data analysis using a Python notebook.
Part 2 - writing a business report.
You will have worked on both these Parts for your Formative Assessment. Now update both Parts for
your Summative Assessment as set out below. You should act on any feedback you received on your
Formative submission, together with your own further learning and development across the module.
2.3. Scenario
Zappy Financial Services (ZFS) is a local company that provides small business loans. Last year, loan
applications increased by over 200%, largely because of a concerted online campaign to establish a
strong digital presence. Almost all loan applications and business leads are generated from search
engines and digital advertisements, reflecting the decision to increase advertising spend on SEO
channels such as Google, Facebook, LinkedIn and similar platforms.
Despite a strong digital marketing approach, the current loan application process remains manual.
It requires the online completion of information, including gender, marital status, number of
dependents, education, income etc. Loan decisions are manually categorised as either approved or
rejected. To date, several of these factors have been considered in the approval decision. All
applications are reviewed and approved by the loan team which, given the recent increase in
volumes, has resulted in skills shortages, longer loan approval times and increased potential
operational and control risk. The current operating model constrains further growth.
You are employed by ZFS as a Consultant Data Analyst, with programming and data analytics
knowledge, as well as a deep appreciation for the need to balance business growth with a robust
control environment. You will be leading this project with a team of programmers, with various
levels of experience, and have been tasked with providing a scalable solution that addresses key
resourcing and control risks.
Specifically, the Board has instructed you to develop and maintain several partial automation
processes that will help the existing loans team, freeing up their time for greater one-on-one
customer contact. You need to provide a data-driven solution while working with a variety of key
stakeholders each with varying objectives such as marketing, internal audit and compliance. You
need to assure the board that you have consulted widely in drawing up requirements and have
considered how the any code produced will be further developed and maintained. You also need to
consider that any code developed will need to be accessible to (used by) other staff such as sales,
customer service and support personnel.
An in-house database administrator (DBA) was able to compile a PDF of past applications which the
loans team are hoping to map to previous loan approval outcomes.
The two files provided by the DBA are:
A file in PDF format called Loans_Database_Table.pdf
An Excel file, called Zappy Loan Data.xlsx
(Note: These same two files are used in the Formative and the Summative).
The first file has been extracted from business loan records from the previous year, and it includes a
loan approval status field (Yes/No) for each application, allowing the business to map inputs to
outcomes for a possible supervised machine learning exercise.
The Excel file is maintained by the Sales team and it is currently being saved in a shared folder. This
increases the chance of duplication and missing values.
You will need to reflect the learnings throughout this module and consider the learning outcomes
particularly LO 3: Construct a programming solution to solve a defined business problem as you
create your answer.
2.4. Part 1: Construct a Programming Solution (30 marks) (LO3)
In Part 1, you will deliver an interactive Python notebook (a . ipynb file) using Google Colab, with the
code used, with comments, to explain the scripts, the libraries used, and the logic. All such
commentary should be written using the built-in markup language (Markdown text) or embedded
using the standard Python syntax.
The notebook which you create should highlight some of the key findings which you have in the data
and the insights which you can provide to the business. The tasks which need to be completed in the
Python Notebook include the following:
Task 1: Loan Data Automation
Create a new .ipynb notebook within Google Colab and load the TWO data files provided by the
DBA. Extract the two datasets from these two files which contains information about past loan
records. The integers shown in each column of the loan datasets are to be interpreted as follows and
you may read them as strings or numbers in your code as you deem appropriate.:
Gender: 1-Male, 2-Female
Married: 0-Single, 1-Married
Dependents: 0, 1, 2, 3+
Graduate: 0-No, 1-Yes
Self_Employed: 0-No, 1-Yes
Credit_History: 0-No, 1-Yes
Property_Area: 1-Urban, 2-Semiurban, 3-Rural
You should use Python to load the information of these datasets in memory. You should also add
comments to your notebook, explaining the steps taken to load the data, how you treated the PDF
data, the libraries called and the overall procedure. Recall this will be used for training colleagues in
future.
Task 2: Descriptive analysis
First, check the datasets and make sure the data that comes from these two files is valid. Ensure
your loan data is correctly indexed on the LoanID column.
Then, clean the loan data. Provide an explanation of the steps taken to ensure data preparation for
analysis such as the correction of duplicates, missing values, outliers etc.
Next, carry out Descriptive analysis on the current loan data. Your notebook file should contain the
code and output of some basic Exploratory Data Analysis (EDA) which must include the following:
The total amount loaned by ZFS.
The average amount loaned.
The average loan term.
The total number of applicants broken down into Approved and Rejected, the
number of males and female in each case, and shown in an appropriate chart.
The maximum and minimum of amounts loaned and shown in an appropriate chart.
The number of self-employed who had their loan approved, expressed as a
percentage of all who had their loan approved, and shown in an appropriate chart.
Optional (additional marks will be given for the following)
The income distribution of all main applicants, showing average and standard
deviation.
The top ten applicants by loan amount.
The distribution of properties (rural, urban etc) of all loan applicants, shown in an
appropriate chart.
The code must be commented using the built-in markup facility in Colab or embedded commentary
so that it can be maintained in future. The output of calculations and visualisations should be
showed in the notebook and in the report in Part 2. This code and outputs should then be copied
and pasted as Appendix 1 in your Part 2 report.
2.5. Part 2: Report - Business Case (60 marks) (LO1, LO2)
Using the scenario given, develop a report that proposes and justifies the continued
development and maintenance of the code that has been written by the programming
team.
The format of the report should include:
a) Introduction: This should first set out the purpose of the report and its structure. It must
then cover the current business environment of companies like ZFS, the problems that the
programming solution has addressed, and what impact and benefits your proposed
development and maintenance of the code might have on the business. You should also
mention the implications of not proceeding and the kind of human resources needed.
There is no need to discuss project finances, but your introduction must comment on the
following:
the source and nature of the supplied dataset and its suitability for data analytics;
what user requirements have been considered (how will the tool be used);
the challenges the team faces in further developing and maintaining the code, the
benefits of using reusable code and any regulatory and ethical implications.
b) Approach: Describe the approach you took to implement your solution. This should be
based on a suitable data analysis lifecycle or framework, such as one covered in the
module, Describe, especially, the key steps taken in loading and preparing the data for
analysis. Use the outputs (calculated values and any charts and visuals) from your EDA in
Part 1 to explain the key findings. Key findings can relate to any business insight that might
be gained from the analysis of the historical loan records, as well as any general lessons
about the approach being taken for this project. The ZFS board want to know if your
approach works, is sustainable and worth building on.
You should provide discussion of
The code libraries used (what these are and why they are needed);
The reasons for choice of language and platform;
The design (e.g., using pseudo code) to aid understanding and allow the design to be
implemented in other languages if needed (code agnostic);
Testing the code (e.g., by using Excel) to confirm that the programme works; and
Maintenance of any code to allow controlled and efficient development (e.g., by
version control using Git and good commentary)
C) Recommendations for future work: Briefly explain how your solution could be further
developed to build a predictive model using the historical data provided. (i.e. A model that can
be trained to predict the outcome of any future loan application.)
This should include a short explanation of the techniques, libraries, tools, and objective
functions used to evaluate the precision of your recommended predictive model.
Note: There is no need to implement your ideas in code or build a predictive model
Your recommendation must also discuss:
- how existing data collection and data quality may be improved;
- if other libraries might be used to increase model accuracy;
- additional training or support the staff will need in order to use these new tools.
- safeguards needed to ensure compliance to regulatory and ethical standards.
Conclusions: A brief conclusion summarising the main points in the report.
Appendices - (Note: these do not add to your word count.)
Appendix 1 Code: Copy and paste the entire contents of your .ipynb file screenshots of
the notebook with the code and markdown text.
Appendix 2 Test Results: Copy and paste any output from Excel showing if it has
confirmed the correct working of your code.
Appendix 3 Your pseudo code for the design.
In writing your report, use the insight and knowledge provided in this module but also leveragesound academic research to support your report. As you develop your work, you should self-evaluate your developing draft against the criteria set out in the Marking Guide below (See Section 5).
3. Report Structure and Referencing
In addition, ten marks are awarded for the overall professionalism of your report and the adoption of
academic standards.
Guidelines:
Your report should follow the section naming structure and order set out in the Brief. You
should also add your own sub-headings as you see fit to demonstrate your ability to develop
structure and content.
Your report should include an auto-generated contents page including section headings and
sub-headings. The contents page should also include a page-referenced list all tables, charts
and figures provided in our report. Remember to number all pages in your report, for
example Page 8 of 12.
Ensure you develop your discussion in a logical progression: Findings, inferences,
conclusions, recommendations.
Do not make general assertions without supporting evidence.
Zero spelling errors and grammatical mistakes
Cite all your sources in the body of the text and in the Referencing using the Harvard
Referencing style http://bpp.libguides.com/Home/StudySupport.
Include a blend of industry research, case studies and academic references.
You should set out your Business Report in one PDF document, according to the following heading
structure.
University Cover Page
Table of Contents
Introduction
Approach
Recommendations
Conclusions
Appendices
You should add sub-headings under this overall structure as you feel fit to demonstrate your ability
to develop the section themes and to provide meaningful sub-structure. But you must use this
overall structure to provide a consistent framework against which your marker will allocate marks.
You will be deducted marks if you do not follow this structure. Also, note that there is NO
requirement for producing an Executive Summary.
Total word count: 2,500. The Cover Page, Table of Contents, References, Appendices, Tables, Charts
and Figures do not count towards word count.
The content of the Python Notebook is not included in the word count.
4. Mapping Learning Outcomes to Assessment Tasks
The table below sets out the mapping between the three Leaning Outcomes and the key tasks in
your Summative Assessment which are designed to test your achievement against these Learning
Objectives.
Are you struggling to keep up with the demands of your academic journey? Don't worry, we've got your back! Exam Question Bank is your trusted partner in achieving academic excellence for all kind of technical and non-technical subjects. Our comprehensive range of academic services is designed to cater to students at every level. Whether you're a high school student, a college undergraduate, or pursuing advanced studies, we have the expertise and resources to support you.
To connect with expert and ask your query click here Exam Question Bank
