Applied Educational Data Mining and Machine Learning DAT4025
- Subject Code :
DAT4025
Task 1: Examine/Explore the Data
Question 1
Converting the following numerical attributeswhich indicate categorical informationto nominal using the 'NumericToNominal' filter will improve data analysis accuracy by guaranteeing that these attributes are handled correctly as discrete categories instead of being mistakenly interpreted as continuous or ordinal values:
- Application mode: Indicates different application modes; each number value corresponds to a certain category.
- Application order: Indicates a categorical data set with a rank between 1 and 6.
- Course: Provides unique course codes that are not inherently numbered in order to identify them.
- Attendance throughout the day or evening: This is a binary property that is best interpreted as categorical.
- Prior qualification: Uses numerical numbers to represent discrete credentials and classify educational levels.
- Nacionality: Different nationalities are represented by categorized numerical codes.
- Mother's qualification: This is a numerical code that indicates the mother of the student's level of education.
- Father's qualification: It uses numerical codes to classify the father's educational attainment, much like the mother's qualification does.
- Mother's occupation: The mother's occupation is identified by numeric numbers that correspond to different occupational categories.
- Father's job: Uses numerical codes to identify the father's job, which are better handled as distinct categories.
- Displaced: A binary property that represents the state of displacement; numeric values indicate category information.
- Special needs education: This indicates if a pupil need special education; this information is best shown as categorical data.
- Debtor: A binary characteristic that represents the status of a debtor; numeric values indicate different statuses.
- Current tuition fees: Shown as category data, this indicates whether or not tuition costs are current.
- Gender: Gender is represented by category numeric codes (male or female).
- Scholarship holder: This field, which is best seen as categorical data, indicates whether the student is a scholarship holder.
- International: A binary property that represents international status and has numeric values for category data.
Question 2
Hump distribution means that the distribution is symmetric or normal with a single peak and an almost equal symmetry on either sides of the peak. Based on this definition, the following variables were identified to be non-symmetrical either because they have multiple peaks or have skewness:
1.Application order
2.Age at enrolment
3.Curricular units 1st sem (credited)
4.Curricular units 1st sem (enrolled)
5.Curricular units 1st sem (evaluations)
6. Curricular units 1st sem (approved)
7.Curricular units 1st sem (grade)
8.Curricular units 1st sem (without evaluations)
9.Curricular units 2nd sem (credited)
10.Curricular units 2nd sem (evaluations)
11.Curricular units 2nd sem (approved)
12.Curricular units 2nd sem (grade)
13.Curricular units 2nd sem (without evaluations)
14.Curricular units 2nd sem (enrolled)
15.GDP, Inflation rate, Unemployment rate
Outliers are the extreme points that affect the mean of a distribution. They often lie far left or far right to the peak. The variables that have outliers based on histogram are:
1.Age at enrolment
2.Curricular units 1st sem (credited)
3.Curricular units 1st sem (enrolled)
4.Curricular units 1st sem (evaluations)
5.Curricular units 1st sem (approved)
6.Curricular units 1st sem (without evaluations)
7.Curricular units 2nd sem (credited)
8.Curricular units 2nd sem (enrolled)
9.Curricular units 2nd sem (evaluations)
10.Curricular units 2nd sem (approved)
11.Curricular units 2nd sem (without evaluations)
The most crucial factor in determining whether students drop out or graduate appears to be the curriculum units completed in the first and second semesters. The first semester is very important since it establishes the students' academic achievement for the rest of the semester. Better comprehension, adjustment to the classroom, and efficient study techniques are reflected in improved first semester grades, all of which increase the chance of graduating. A second semester of poor results might be a sign of continued difficulty with the material, a loss of interest, or other circumstances that have an impact on academic achievement. A student's capacity to persevere and successfully finish their studies is strongly indicated by consistently excellent marks in both the first and second semesters.
Task 2: Unsupervised Clustering Basics
Question 3
When examining student outcomes, clustering technique known as K-Means can provide valuable insights. At the heart of this approach are the centroids the central points that summarise the key attributes of each cluster. By analysing such centroids, we can un cover the factors that distinguish successful students from those who struggle.
In our analysis, we've identified two distinct clusters: Cluster 0, representing dropouts, and Cluster 1, representing graduates. A closer look at the centroids reveals several notable differences between these groups.
First and foremost, the age at enrollment shows a significant disparity. Students in Cluster 0 (dropouts) tend to be older, with an average age of 25.93, compared to 22.34 for those in Cluster 1 (graduates). This suggests that older students may face a higher risk of attrition.
Furthermore, academic performance appears to be a critical differentiator. The centroids indicate that students in Cluster 1 consistently outperform their peers in Cluster 0 across both the first and second semesters. In the first semester, Cluster 1 students earned an average grade of 11.64, while Cluster 0 students averaged 8.10. This trend continued into the second semester, with Cluster 1 students achieving an impressive 11.54 compared to only 6.70 for Cluster 0.
According to this data, the curricular unit grades (both first and second semester) seem to be the most helpful characteristic for grouping dropout students. Grades appear to be the most telling characteristic that separates the two clusters; the "Dropout" cluster (Cluster 0) has far lower grades than the "Graduate" cluster (Cluster 1). This conclusion makes sense because children's academic achievement probably plays a major role in deciding whether or not they drop out of school.
Task 3: Classifier Basics
Question 4
A baseline performance indicator must be established before assessing a machine learning model's accuracy. To provide a baseline for comparison in this instance, the ZeroR classifier is used.
60.854?curacy on the training set is attained by the straightforward yet efficient ZeroR model. This indicates that 60.854% of the occurrences are accurately classified by ZeroR since it consistently predicts the majority class, which in this case is "Graduate." Being able to establish a minimal threshold for more complex classifiers is what makes the ZeroR baseline significant. An accuracy higher than the ZeroR benchmark is required for any model to be deemed useful. If a classifier's performance is on par with or even lower than ZeroR, it suggests that the model is not effectively learning from the data beyond the basic majority class distribution.
Question 5
According to the decision tree generated by Weka using J48 algorithm , the single most informative feature for predicting student drop out is the Curricular units 2nd semester (approved) attribute as it is the root node of the tree.
- The "Curricular units 1st sem (enrolled)" section of the tree is examined if the student has three or less approved curricular units in the second semester. The model anticipates dropout in the event that the student has no units enrolled for the first semester and their tuition is not paid. Other variables like "Debtor" and "Scholarship holder" are taken into consideration if the student has enrolled units.
- Predicting success in the second semester gets more difficult if the student has more than three approved units. Additional features that must be verified include "Nationality" and "Tuition fees up to date".
The above analysis resultsis consistent with the response to Question #2, highlighting the critical significance of 1st and 2nd semester performance in forecasting graduation or dropout rates.
Question 6
The decision tree model employed in this analysis has undergone a process of discretization for several numeric variables. The discretized attributes include:
- Curricular units 1st sem (credited)
- Curricular units 1st sem (enrolled)
- Curricular units 2nd sem (approved)
- Curricular units 1st sem (grade)
- Curricular units 2nd sem (grade)
These attributes were chosen for discretization because of their narrower range of values which can be better put into separate categories for easier analysis.
92.8099% was the Correctly Classified Instances rate attained by the decision tree classifier prior to discretization. This rate rose to 93.42% following discretization. Discretization can help the decision tree see patterns and divide data more efficiently by turning continuous values into discrete buckets. Discreteized values have the potential to mitigate noise in the data and enable the algorithm to concentrate on the most significant differences between various ranges of the numerical characteristics. The discretization process was crucially supervised, which means that class labels were utilized to direct the data' binning. This method is very useful since it maximizes class distinction by optimizing the bins, guaranteeing that the resultant categories are the most informative for the prediction job.
Question 7
Ten equal portions, or folds, make up the dataset in 10-fold cross-validation. Next, nine of these folds are used to train the model, and the last fold is used for testing. Ten iterations of this method are carried out, with one test set for each fold. The average of the accuracies attained in each of the ten folds is used to report the model's ultimate accuracy.
The main advantage of 10-fold cross-validation is that it offers a more accurate assessment of the model's performance using fresh, untested data. Overfitting occurs when a model learns from all of the dataset and performs very well on it, but might not adapt well to new data. This can happen when a model is trained on all of the dataset and assessed on the same data.
On the other hand, the 10-fold cross-validation method assists in identifying and addressing this overfitting problem. Through cross-validation, a more accurate evaluation of the model's actual performance is possible by testing the model on several subsets of the data. This is seen by the lower but more realistic accuracy of 88.93% attained after 10-fold cross-validation compared to the initial model's accuracy of 92.8%.
Task 4: Build Your Own Classifier
Question 8
The classifiers I have tried as well as their True Positive Rates, False Positive Rates, Precision and Recall using 10-fold cross-validation are shown in below table:
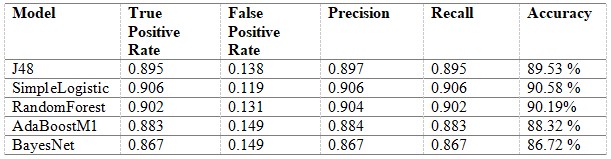
The analysis's findings demonstrate that, out of all the classifiers examined, the SimpleLogistic classifier turned out to be the most effective one. The SimpleLogistic classifier's great performance may be ascribed to its capacity to accurately represent the linear connections present in the data. The classifier was able to produce precise predictions because of the model's linear structure, which appears to have matched the dataset's underlying patterns well. The RandomForest model stood up as a great performer in addition to the SimpleLogistic classifier, narrowly lagging the latter in performance indicators. The RandomForest algorithm's precise and reliable predictions may probably be attributed to its ensemble-based design, which blends many decision trees.
AdaBoostM1 and BayesNet, two of the classifiers with the lowest performance, were also emphasized in the analysis. The BayesNet classifier may have difficulty with the relationships and complexities of the data, which explains why its performance is relatively poor. The probabilistic correlations between variables are what Bayesian networks are by their very nature intended to model. AdaBoostM1 may have performed subparly because the weaker classifiers in the ensemble were unable to adequately identify the underlying patterns in the data, which contributed to its somewhat poorer performance when compared to the best-performing classifiers.
Question 9
The chosen model for further analysis is the SimpleLogistic model, which achieved the best performance metrics compared to the other models evaluated in the previous question (Question #8).
The specific configuration of the SimpleLogistic model is:
- Weka classifier: weka.classifiers.functions.SimpleLogistic
- Parameters:
o-I 90: Number of iterations
o-M 500: Maximum number of boosting iterations
o-H 750: Hidden layer size
o-W 0.0: Ridge
o--batch-size 150: Batch size
Below table compares the performance of the same classifier based on different parametric configurations.
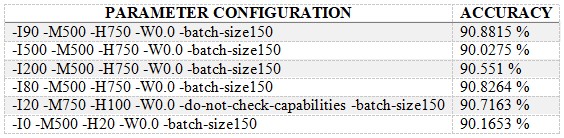
The model's capacity to learn complicated patterns is often enhanced by increasing the number of boosting iterations (-I). However, this can eventually cause overfitting, as demonstrated by the -I 500 configuration, which caused the accuracy to decrease to 90.03%. The optimal results were obtained with -I 80 and -I 90, suggesting a compromise between generalization and model complexity. The maximum iterations of 500 (-M) were consistently applied to all configurations, ensuring that the model had adequate training chances to converge. While the configuration of 750 hidden units performed well, decreasing it to 100 or 20 resulted to a minor loss in accuracy. In order to provide robust model training without significantly increasing variability, a constant batch size of 150 (-batch-size) was chosen. For balanced datasets, the weight was maintained at 0.0 (-W), signifying the absence of extra weighting.
The chosen parameters (-I90 -M500 -H750 -W0.0 -batch-size150) provided a good balance between model complexity and generalization, leading to high accuracy and low error rates. In comparison to the initial default-model, this set of parameters greatly decreased the time required for the development of the model, indicating a thoughtful approach to model improvement and the selection of the best parameters to achieve high performance.
Are you struggling to keep up with the demands of your academic journey? Don't worry, we've got your back!
Exam Question Bank is your trusted partner in achieving academic excellence for all kind of technical and non-technical subjects. Our comprehensive range of academic services is designed to cater to students at every level. Whether you're a high school student, a college undergraduate, or pursuing advanced studies, we have the expertise and resources to support you.
To connect with expert and ask your query click here Exam Question Bank
