BTEC Applications Of Inorganic Chemistry Assessment
- Subject Code :
BTEC
- Country :
Australia
Vocational Scenario or Context
You are a quality control technician working for Severn Trent Water. An essential part of your work is to accurately determine the pH of the water and dissolved chemicals at each stage in the treatment process. For safety reasons, and so that pipework and pumps are not damaged, the pH must always be within the 6 - 10 range. Because your department regularly receives visits from schools, your manager has allocated you the task of designing a training programme for the A level and BTEC work experience students. You will be expected to include theory notes, and demonstrate the use and action of buffer solutions and practical acid-base tit-rations (including how to interpret the results of the tit-rations). You will justify why certain indicators are used for certain tit-rations. Your supervisor has also provided you with pH calculations for the students to complete. You will need to work out the correct answers, showing your workings, so you can help the students if they are unsure of how to calculate the answers. You will need to evaluate different acid-base tit-ration methods as part of the design of your training programme. If your manager is happy that you are confident in your technical ability and subject knowledge, you will become the official placement supervisor for future work experience visits.
Task
Using your lesson notes and research into acid-base equilibrium and acid-base tit-rations, you will prepare a portfolio of notes, practical records, calculations and reports that will form the basis of a training programme for A level and BTEC work experience students. Specifically, your portfolio will include the following five sections:
- Acid & Base Strength - calculations to demonstrate understanding of acid / base / buffer strength
- You will perform straightforward and complex calculations to find pH, concentration of H+ ions and acid dissociation constants (Ka) for various acids, bases and buffer solutions by completing the Acid-Base Calculations Test. Ensure that you show full working out, units and an appropriate level of accuracy for all of your answers.
- Values of Ka practical work to determine Ka for a weak acid
- You will demonstrate how to accurately determine Ka for ethanoic acid by following the method in the worksheet Determining the acid dissociation constant (Ka) for a weak acid
- Use your results to calculate the pKa and therefore the Ka of ethanoic acid.
- Compare your values to published values to determine the accuracy of your measurement of Ka
- Buffer Solutions - practical work to demonstrate and discuss the action of buffers
- You will make a buffer solution using ethanoic acid as the weak acid and sodium ethanoate as its conjugate base / salt. Using an accurately calibrated pH meter, measure the pH of your solution. Use the Henderson-Hasselbach equation to calculate the theoretical pH of your solution and compare it with the actual pH measured.
- Having made your buffer solution, demonstrate buffer action by adding small amounts of a strong acid and of a strong alkali to separate samples of the solution (e.g. a few drops followed by 1 cm3 and finally a larger quantity of 0.1 mol dm-3 solution). Measure the quantities of acid or alkali added during your experiment and the pH reading. Record your results in a logical table and draw clear conclusions from your results that explains the buffer action of your solution and assesses the limits of this action.
- Explain and assess the buffer action that occurs in blood to exemplify to the students why buffers are so important.
- Indicators - titration practical work to determine the selection of an indicator (see Determining pH curves for acid-alkali titrations worksheet)
- Carry out pH titrations of the following solutions (use 0.1 mol dm-3 concentrations), adding 0.5 cm3 of titrant at a time (reduce this to 0.1 cm3 when close to the end point) and noting the pH (measured using an accurately calibrated pH meter):
- 25 cm3 of hydrochloric acid titrated with sodium hydroxide
- 25 cm3 of hydrochloric acid titrated with ammonia solution
- 25 cm3 of ethanoic acid titrated with sodium hydroxide
- 25 cm3 of ethanoic acid titrated with ammonia solution.
Present your readings of volume of alkali and pH in a logical results table. Ask your assessor to complete a witness statement or observation record that witnesses your accurate use of a pH meter to gather data. Alternatively, you could video record your use of the pH meter and submit this as evidence.
- Using Excel (or other suitable computer software), plot scatter graphs of pH against volume and ?pH/?volume against volume to determine the end point for each of the titrations.
- Next, you will need to carry out research into a wide range of indicators that could be used in acid-base titrations. You will need to establish the colour changes and effective pH range of the indicators that you research.
- By examination of your graphs, select and propose a suitable indicator from your research for each titration. Justify your selection of a specific indicator for each of the titrations, taking into consideration the pH range of the indicator and the rapid change in pH in the pH versus volume curve for each titration. You must qualify why you have chosen one indicator over other possible indicators from your research.
- Carry out pH titrations of the following solutions (use 0.1 mol dm-3 concentrations), adding 0.5 cm3 of titrant at a time (reduce this to 0.1 cm3 when close to the end point) and noting the pH (measured using an accurately calibrated pH meter):
- Titration Techniques - evaluative report of different titration techniques
- Write a report evaluating three different titration techniques: titration using a pH meter, titration using an indicator, and titration by autotitrater. This should be based upon a variety of sources of information, examine strengths and weaknesses of each, and allow you to draw a conclusion on the best use of each.
Your evaluation of each technique should include consideration of:- accuracy of results
- Cost
- maintenance and calibration
- amounts of titrant used advantages and disadvantages (eg reliability, precision, use of the correct or incorrect indicator, etc)
For your practical work, put together method sheets and photographs of each stage to illustrate the experiments for the work experience students. - Write a report evaluating three different titration techniques: titration using a pH meter, titration using an indicator, and titration by autotitrater. This should be based upon a variety of sources of information, examine strengths and weaknesses of each, and allow you to draw a conclusion on the best use of each.
Determining the acid dissociation constant (Ka) for a weak acid
Aim
The purpose of this experiment is to accurately demonstrate a reading of pH of a half-neutralised solution of ethanoic acid and from this determine a value for Ka.
Introduction
You will first accurately determine the titre of sodium hydroxide solution required to neutralise 25.0 cm3 of 1.0M ethanoic acid. You will then neutralise exactly half of a new sample of 25.0 cm3 of ethanoic acid with sodium hydroxide and accurately measure the pH of the resulting solution in order to determine Ka.
Chemicals and Equipment
- ethanoic acid (approx. 0.1M)
- sodium hydroxide solution (0.1M)
- safety spectacles
- 1 burette, 50 cm3, and stand
- 1 funnel, small
- pipette, 25.0 cm3, and pipette filler
- 1 beaker, 250 cm3
- 1 conical flask, 250 cm3
- distilled water
- pH meter (accurately calibrated)
CAUTION:
Sodium hydroxide solution is corrosive. You must wear safety spectacles throughout the experiment.
Method
- Clamp the 50 cm3 burette to the stand. Using a funnel, rinse and fill the burette with 0.1M sodium hydroxide solution.
- Using a pipette filler, rinse the pipette with some of the ethanoic acid and transfer precisely 25.0 cm3 of the solution into a 250 cm3 conical flask.
- Add 2-3 drops of phenolphthalein indicator solution to the conical flask and swirl to mix.
- Run sodium hydroxide solution from the burette, with swirling until the solution just turns pink and is permanent.
- Repeat the titration until you have obtained concordant titres. Calculate the mean titre (V cm3).
- Pipette precisely 25.0 cm3 of the ethanoic acid solution this time into a 250 cm3 beaker. Do not add phenolphthalein indicator.
- Run exactly V/2 cm3 of sodium hydroxide solution from the burette into the beaker of ethanoic acid. This is the volume required to neutralise exactly half of the ethanoic acid.
- Swirl gently to ensure that the solutions are well mixed.
- Place an accurately calibrated pH meter into the beaker so that the tip of the probe is completely immersed in the solution you have made.
- When the reading is stable, read and record the final pH of the solution in the beaker.
- Repeat the half-neutralisation steps again in order to obtain a reliable average pH reading.
Results
| Trial run | 1st run | 2nd run | 3rd run (if required) | 4th run (if required) | |
|---|---|---|---|---|---|
| Initial reading / cm3 | |||||
| Final Reading / cm3 | |||||
| Titre (volume used) / cm3 | |||||
| Mean titre (V) / cm3 | |||||
| V/2 / cm3 |
pH of half-neutralised ethanoic acid solution (1st run)
pH of half-neutralised ethanoic acid solution (2nd run)
pH of half-neutralised ethanoic acid solution (3rd run, if required)
Average pH value
Calculation
The acid dissociation constant for a weak acid (Ka) is given by the equation:
Ka=[h^+][A^-]/[HA]
When a weak acid is half-neutralised, the concentration of the weak acid [HA] is equal to the concentration of its conjugate base [A-] (ie [HA] = [A-]), so the equation for Ka can be expressed as
Ka = [H+] or pKa = pH
at the half-neutralisation point
The expression can be rearranged to give
Ka = 10-pH
Using the rearranged equation, now calculate the value of Ka value for your solution of ethanoic acid.
Compare this against a referenced source for Ka for ethanoic acid and comment upon the accuracy of your practical determination of the value.
Determining pH curves for acid-alkalis titrations
Aim
The purpose of this experiment is to obtain curves, which show how the pH changes during an acid-base titration, and to use these curves to choose suitable indicators for different combinations of acid and alkali.
Introduction
You will have available two acids (one strong, one weak) and two alkalis (one strong, one weak) giving four possible combinations. For each combination, you run the alkali from a burette, in small steps, into 25 cm3 of the acid and measure the pH at each addition. You then plot pH against volume of alkali added. Measure pH with a pH meter.
Chemicals and Equipment
- hydrochloric acid (0.1M)
- sodium hydroxide solution (0.1M)
- ethanoic acid (0.1M)
- ammonia solution (0.1M)
- safety spectacles
- 2 burettes, 50 cm3, with stands
- 2 funnels, small
- 2 pipettes, 25.0 cm3, and pipette filler
- 2 conical flasks, 250 cm3
- 4 beakers, 250 cm3, with labels
- distilled water
- pH meter (accurately calibrated) and stand with clamp
- distilled water
CAUTION:
Sodium hydroxide solution is corrosive. You must wear safety spectacles throughout the experiment.
Method
- Clamp a 50 cm3 burette to the stand. Using a funnel, rinse and fill the burette with 0.1M sodium hydroxide solution. Using a pipette filler, rinse the pipette with some of the hydrochloric acid and transfer precisely 25.0 cm3 of the solution into a 250 cm3 conical flask. Add 2-3 drops of phenolphthalein indicator solution to the conical flask and swirl to mix. Run sodium hydroxide solution from the burette, with swirling until the solution just turns pink and is permanent. Record the volume of the titre as this will be useful to you in judging the size of the volumes that you will add in the next part of the experiment.
- Pipette 25.0 cm3 of 0.1M hydrochloric acid this time into a 250 cm3 beaker.
- If they are available, add a small stirring bar to the beaker and stand on a magnetic stirrer. If a stirrer is not available, then you will have to swirl the beaker gently by hand during the titration.
- Carefully clamp the electrode of a pH meter so that the bulb is completely immersed in the acid and is clear of the stirring bar. Record the pH of the solution.
- Run sodium hydroxide solution from the burette into the hydrochloric acid in steps of 0.5 cm3. After every addition ensure that the solutions are well mixed. Record the volume of alkali added and the pH measured.
- As you get closer to the end point, you will need to start to add amounts of 0.1 cm3 of the alkali so that you can record more readings of pH to improve the accuracy of your titration curve.
- After the end point has been passed, continue to titrate in steps of 0.5 cm3 once again, recording both the volume of alkali added and the pH measured.
- Continue the titration until you have added 50 cm3 of the alkali in total.
- Repeat steps 1-8 with each possible combination of the acids and alkalis provided, and record the results of volume of alkali added and pH measured in suitably designed results table.
- For each of the four possible combinations of acid and alkali, plot a graph (produced using Excel or other appropriate computer software) of:
- pH against volume of alkali
- ?pH/?volume against volume
Use these to determine pH range over the end point for each titration.
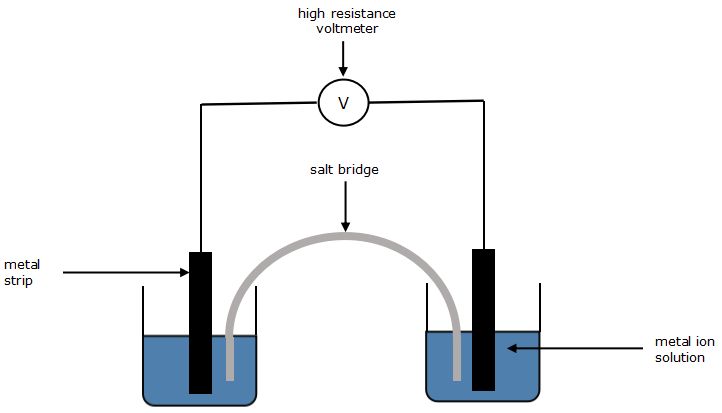
Measuring cell potentials
Aim
The purpose of this experiment is to construct three electrochemical cells, and to measure the potential difference between the electrodes, noting the polarity.
Introduction
You will construct the cells given below according to the method and measure the potential difference between the metal electrodes using a high resistance voltmeter.
- Zn(s) | Zn2+(aq) Cu2+(aq) | Cu(s)
- Zn(s) | Zn2+(aq) Pb2+(aq) | Pb(s)
- Pb(s) | Pb2+(aq) Cu2+(aq) | Cu(s)
When measuring the potential difference between the electrodes of each cell, the polarity of each electrode is indicated by the positive sign and negative sign on the voltmeter (or red and black terminals respectively). Thus, you can determine at which electrode electrons are needed and at which electrode electrons are produced. From this, you can work out the direction in which the overall reaction proceeds.
Diagram
Chemicals and Equipment
- copper(II) sulfate solution (0.1M)
- zinc sulfate solution (0.1M)
- lead(II) nitrate solution (0.1M)
- strip of copper foil (or wire)
- strip of zinc foil (or wire)
- strip of lead foil (or wire)
- emery paper, 3 small pieces
- saturated potassium nitrate solution
- safety spectacles
- 4 beakers, 50 cm3
- 3 measuring cylinders, 20 cm3
- 3 connecting leads with crocodile clips attached
- filter paper strips
- voltmeter, high resistance
CAUTION:
Copper(II) sulfate solution is harmful.
Lead(II) nitrate is toxic.
You must wear safety spectacles throughout the experiment.
Method
- If necessary, clean each metal strip (or wire) with a separate piece of emery paper.
- Place each metal strip in a separate beaker. Hold each strip vertically against the inside of the beaker so that about 2 cm projects above the rim. Fold the projection down over the rim of the beaker and clamp it in position with a crocodile clip attached to a lead.
- Pour approximately 20 cm3 of the appropriate salt solution into each beaker and ensure that each metal strip dips into a solution of its own ions. Ensure that the crocodile clips remain dry.
- Prepare a salt bridge by soaking a strip of filter paper in saturated potassium nitrate solution. Allow the surplus solution to drain off by hanging the strip over the fourth beaker.
- Connect the zinc and copper electrodes to a high resistance voltmeter, as shown in the diagram below and complete the circuit with the salt bridge.
- If the reading on the voltmeter is negative, reverse the connections to obtain a positive reading. Record the potential difference in a suitably designed results table, noting which electrode is positive (connected to the red terminal of the voltmeter) and which is negative.
- Remove the salt bridge as soon as possible and throw it away. Disconnect the voltmeter.
- Repeat steps 4 to 7 for the other two cells.
- Using appropriate standard reduction potential data, calculate a theoretical value for the potential difference of each cell. Compare the potential differences for the cells that you measured in your experiment with those that you have calculated and comment upon the accuracy and any differences that you observe.
Oxidation/Reduction equation worksheet
For the following six reactions, identify the oxidation numbers of the elements in the elements and compounds involved.
From this, determine which equations are examples of redox reactions and which are not.
- NaCl (aq) + AgNO3 (aq) AgCl (s) + NaNO3 (aq)
- H2 (aq) + F2 (aq) 2HF (aq)
- PCl5 (aq) + 4H2O (l) H3PO4 (aq) + 5HCl (aq)
- Zn (s) + 2HCl (aq) ZnCl2 (aq) + 2H2 (g)
- Ca(OH)2 (aq) + 2HCl (aq) CaCl2 (aq) + 2H2O (l)
- 3CuS (s) + 8HNO3 (aq) 3CuSO4 (aq) + 8NO (g) + 4H2O (l)
- KMnO4 (aq) + 6H2SO4 (aq) 2K2SO4 (aq) + 4MnSO4 (aq) + 6H2O (l) + 5O2 (g)
Balance the following redox equations, by identifying and using the oxidation numbers within each species and the numbers of electrons lost or gained.
- Fe2+ (aq) + MnO4- (aq) + H+ (aq) Fe3+ (aq) + Mn2+ (aq) + H2O (l)
- IO3- (aq) + H+ (aq) + S2O32- (aq) I- (aq) + S4O62- (aq) + H2O (l)
- S2O32- (aq) + I2 (aq) I- (aq) + S4O62- (aq)
Reactions of transition metal complex ions
For your transition metal complex ions you will need to select five of the following solutions (of concentration 0.1M):
- titanium(III) sulfate
- ammonium vanadium(III) sulfate
- chromium(III) chloride
- manganese(II) chloride
- iron(II) sulfate
- iron(III) chloride
- cobalt(II) sulfate
- nickel(II) sulfate
- copper(II) sulfate.
Carry out the following tests on separate samples of each transition metal ion solution that you have selected:
- Add 2M sodium hydroxide dropwise solution until an excess is present
- Add 2M ammonium hydroxide solution dropwise until an excess is present
- Add 1.5M sodium carbonate solution dropwise until an excess is present
- Add concentrated ammonia solution dropwise until an excess is present
- Add concentrated hydrochloric acid dropwise until an excess is present
Make a note of the colours of the transition metal complexes initially, the precipitation of insoluble compounds and any colour changes. Also note whether any precipitates dissolve in an excess of a reagent.
You will need to design a suitable table for your results before starting your experiments.
For this experiment, you will need to take suitable precautions and carry out a full risk assessment before carrying out any practical work. You must have your assessors permission to carry out your experiment only after a full review of your risk assessment.
