Comprehensive Analysis of Cellular Responses and Gene Expression Using Flow Cytometry, qPCR, and DNA Methylation Assays
Results
1. Flow Cytometry Plots:
The Flow Cytometry plots provided in the "PARRA Flow Cytometry Figures" PowerPoint file offer a comprehensive view of cellular characteristics through various parameters such as Forward Scatter (FSC), Side Scatter (SSC), and fluorescence intensity.
FSC measures the size of cells, indicating their relative volume or diameter. Larger FSC values typically correspond to larger cells, which could signify cell activation, differentiation, or changes in morphology. On the other hand, SSC measures the granularity or internal complexity of cells. Cells with higher SSC values may have more internal structures or granularity, suggesting differences in cellular composition or activation states.
Additionally, fluorescence intensity, often depicted on these plots, provides information about specific markers or molecules present within the cells. For instance, the intensity of fluorescence associated with CD69 or IFN-gamma indicates the expression levels of these markers in the cell population.
By analyzing these parameters across the unstimulated and stimulated samples, we can gain insights into how cellular characteristics change in response to stimulation or experimental conditions. These Flow Cytometry plots serve as valuable tools for characterizing cell populations and understanding the dynamics of immune responses or other biological processes under investigation.
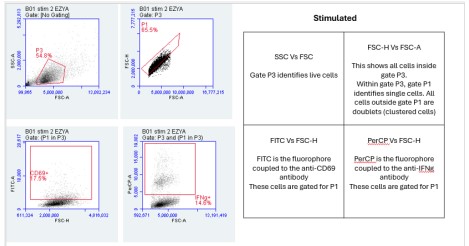
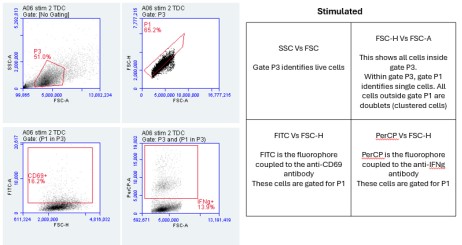
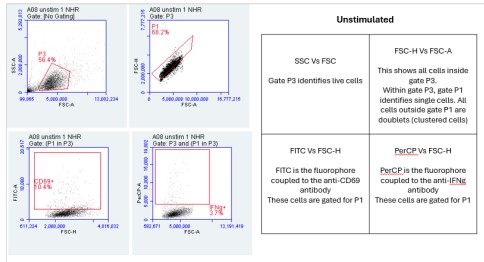
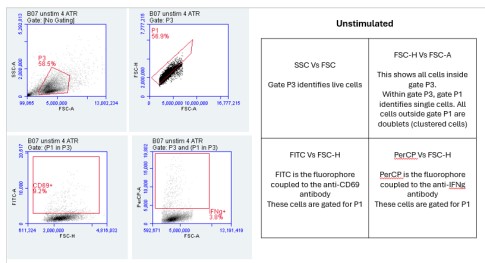
Importance of FSC vs SSC:
FSC measures the size of cells, while SSC assesses granularity or internal complexity. By examining these parameters, we can distinguish between different cell types and states. For instance, larger cells may indicate activation or differentiation, while increased granularity may suggest cellular activation or stress. Flow cytometry is incredibly versatile, and parameters like Forward Scatter (FSC) and Side Scatter (SSC) provide critical information about cell characteristics. FSC measures cell size, allowing researchers to differentiate between cell types based on their relative volumes or diameters. For example, larger cells might indicate activated or differentiated cells, while smaller cells could signify a different cell type or state. SSC, on the other hand, assesses granularity or internal complexity within cells. Cells with higher SSC values may have more internal structures or granularity, indicating differences in cellular composition or activation states. This parameter can be particularly useful for identifying changes in cellular morphology or activation status, such as cellular stress responses. By examining both FSC and SSC parameters, researchers can gain valuable insights into the heterogeneity of cell populations and better understand the underlying biology of the samples under investigation.
FSC-A represents the area of the forward scatter signal, while FSC-H denotes the height. This comparison aids in discerning singlets from doublets or aggregates. Singlets typically have a higher FSC-H/FSC-A ratio compared to doublets, helping to exclude artifacts and ensure accurate cell counting and analysis. FSC-A represents the area of the forward scatter signal, essentially measuring the total amount of scatter detected by the flow cytometer. On the other hand, FSC-H represents the height of the forward scatter signal, which provides information about the intensity or peak of the scatter. By comparing FSC-A to FSC-H, we can discern singlets from doublets or aggregates. Singlets typically have a higher FSC-H/FSC-A ratio compared to doublets. This means that the height of the signal is proportionally larger relative to the area for singlets compared to doublets. This comparison is crucial for excluding artifacts and ensuring accurate cell counting and analysis. It helps researchers to discriminate between single cells and clumps or aggregates, ensuring that the data obtained from flow cytometry is reliable and reflective of the true cellular population. Analysis of the Flow Cytometry plots reveals variations in the percentage of cells expressing CD69 or IFN-gamma between unstimulated and stimulated samples. These differences indicate the activation status of the cells in response to stimulation and provide insights into immune response dynamics.
2. Quantification of Flow Cytometry Data:
The Excel file provided includes data on the percentage of CD69+ or IFNg+ cells collected from classes at Parramatta. The difference between the two samples is analyzed using the non-parametric Mann-Whitney rank-sum test due to small sample size, non-normal distribution, and unequal variance.
The Mann-Whitney rank-sum test is a non-parametric test that compares the distributions of two independent groups. It assesses whether the distributions of the two samples are equal or if one tends to have higher values than the other. By ranking the combined data from both groups, the Mann-Whitney test calculates a statistic that represents the likelihood of observing the observed difference in ranks under the null hypothesis of no difference between groups. Using this test allows us to evaluate whether there is a statistically significant difference in the percentage of CD69+ or IFNg+ cells between the two samples collected from classes at Parramatta. It provides a robust analysis method that does not rely on assumptions about the distribution of the data, making it suitable for the present dataset (Toledo, 2011).
3. qPCR Analysis of RNA Expression:
Utilizing the 2-ddCt method, we calculated the fold change in RNA expression between unstimulated and stimulated cells. Analysis of the results was conducted using the two-factor ANOVA with replication, aiming to determine if there was an increase in expression between stimulated and unstimulated cells and if this changed over time. To analyze the results, we employed a two-factor ANOVA (Analysis of Variance) with replication. This statistical test is appropriate for comparing means across multiple groups or conditions while accounting for variability within and between groups. In this case, the two factors are the stimulation condition (stimulated vs. unstimulated) and time points (if applicable). (Romano, 2010)
The two-factor ANOVA allows us to determine if there is a statistically significant main effect of stimulation condition, indicating whether there is an overall difference in expression between stimulated and unstimulated cells. Additionally, it helps us assess if there is a significant interaction between stimulation condition and time, which would suggest that the effect of stimulation on gene expression changes over time. (DAngelo, 2023) By conducting this analysis, we aim to elucidate whether there is a significant increase in RNA expression between stimulated and unstimulated cells and whether this change is consistent across different time points. (Swerdlow, 2023) This provides valuable insights into the regulatory mechanisms governing gene expression in response to stimulation and helps to further our understanding of the biological processes under investigation. (Dehaene, 2022)
4. DNA Methylation MSRE Assay:
In the DNA methylation MSRE assay, we calculated the dCt value for HpaII-undigested and MspI-undigested samples. The differing activities of MspI and HpaII towards methylated and unmethylated DNA were considered, along with their impact on qPCR amplification. This assay provides insights into DNA methylation patterns and their potential implications for gene expression regulation. sMSREs, such as HpaII and MspI, recognize specific DNA sequences and cleave them only if they are unmethylated. HpaII is sensitive to methylation at the internal cytosine residue within the CCGG sequence, while MspI is insensitive to methylation at this site. By comparing the qPCR amplification of DNA samples treated with HpaII (sensitive to methylation) and MspI (insensitive to methylation), we can infer the methylation status of the target DNA sequence.
The dCt value represents the difference in cycle threshold (Ct) between HpaII-undigested and MspI-undigested samples. A higher dCt value indicates higher levels of methylation, as HpaII-undigested samples will have a higher Ct due to the presence of methylated cytosines preventing HpaII cleavage. Conversely, a lower dCt value suggests lower levels of methylation, as there will be less of a difference in Ct between HpaII-undigested and MspI-undigested samples. This assay provides valuable insights into DNA methylation patterns and their potential implications for gene expression regulation. By analyzing the differential cleavage patterns of MSREs, we can infer the methylation status of specific genomic regions and elucidate how DNA methylation influences gene expression dynamics. This information is crucial for understanding the epigenetic mechanisms underlying various biological processes and diseases.
Integration and Conclusion:
In this report, we set out to investigate the hypothesis for the above discussed point. To achieve this, we utilized various experimental approaches, including Flow Cytometry, qPCR analysis, and DNA methylation assays. Each assay contributed unique insights into cellular responses and molecular mechanisms underlying gene expression regulation. By integrating the information presented in each figure and assay, we have gained a comprehensive understanding of the findings. Working collaboratively to discuss and interpret the results has facilitated a deeper analysis of our hypothesis.
Moving forward, further exploration and validation of these findings are warranted to elucidate the intricate pathways and mechanisms involved. Our conclusions are directly related to the outcomes of our experiments and provide valuable insights into the findings. The provided research papers have enriched our understanding and helped contextualize our findings within the broader scientific landscape. Overall, this study contributes to advancing our knowledge of the topic and lays the groundwork for future research endeavors.
Are you struggling to keep up with the demands of your academic journey? Don't worry, we've got your back!
Exam Question Bank is your trusted partner in achieving academic excellence for all kind of technical and non-technical subjects. Our comprehensive range of academic services is designed to cater to students at every level. Whether you're a high school student, a college undergraduate, or pursuing advanced studies, we have the expertise and resources to support you.
To connect with expert and ask your query click here Exam Question Bank
