MAN6927 Supply Chain Analytics: Case Study
- Subject Code :
MAN6927
- Country :
Australia
Problem 1: Transportation network planning (10 marks)
Goods West is a manufacturing company headquartered in Western Australia. It has five plants which serve different states. Tables 1-3 show the necessary data on the fixed cost of operating plants and the variable manufacturing and transportation costs
Table 1. Fixed cost of operating plants and their annual production capacity.
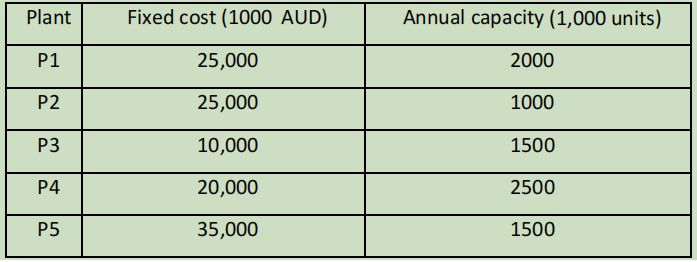
Table 2. Annual demand at each market (1,000 units)
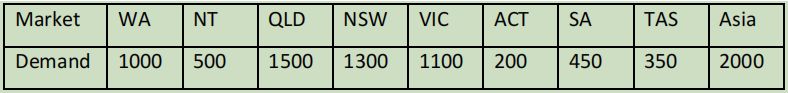
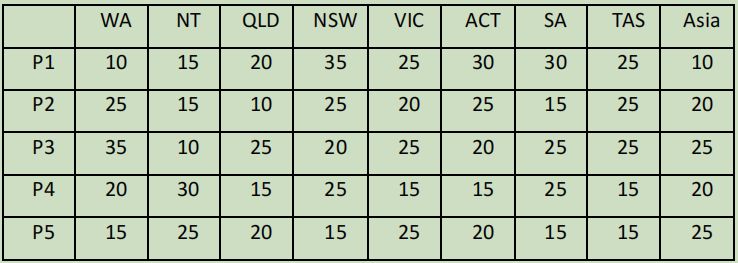
Table 3. Transportation cost of every 1,000 units (1,000 AUD)
Note 1:
Every question is independent of the previous ones. It means that to answer each question, suppose that it is the only question.
Note 2.
Explain your findings for each question in simple terms.
- How many products should be transported from each manufacturer to each market to minimize the total cost for Goods West?
- What is the total cost for Goods West in the optimal situation?
- From Australian markets, WA, NSW, and VIC want to be single-sourced. What are the optimal transportation quantities and the total cost in this case?
- Due to the COVID-19 pandemic, demand in QLD has decreased to 1000 and Asian demand has decreased to 1500.What is the optimal transportation planning in this case? Which plant should be closed to minimize the total cost?
- Goods West is considering feeding the Asian market just from P3 and P4. What are the cost implications of this decision?
Problem 2: Demand Forecasting (10 marks)
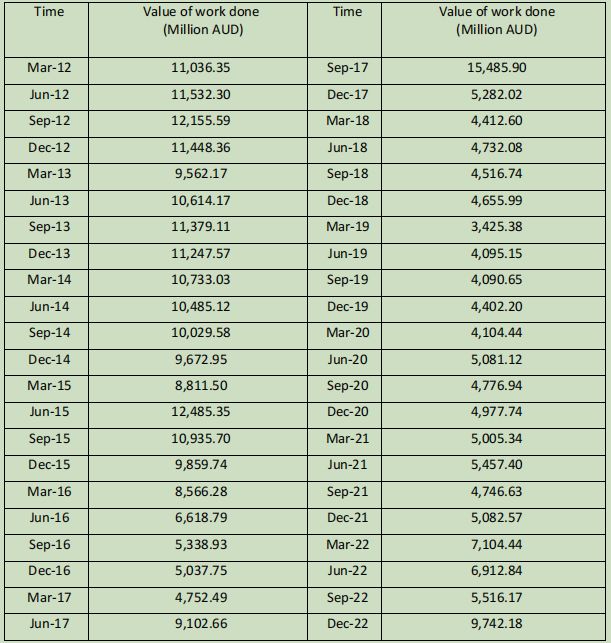
Table 4 shows the value of construction works done in Western Australia by season from 2012 to 2022. Suppose that these data follow seasonal changes every four seasons.
- Deseasonalise data and discuss whether there is any trend in the value of construction works done in Western Australia?
- Forecast the value of construction works for Western Australia over 2023 using Holts model () and Winters model ().
- Calculate the forecasting accuracy measures for both methods and explain them.
- Explain which method provides a better forecast. Why?
- There is a very high jump in September 2017. Suppose that the value of construction works is 8,500 in September 2017. Following the same process as above, which method provides a better forecast for 2023? Discuss the major differences in all findings.
Table 4. The value of work done in WA
Problem 3: CASE STUDY: Kloss Planters and Harvesters (8 Marks)
Read the case study Kloss Planters and Harvesters on page 238 of the textbook (https://ecu.on.worldcat.org/oclc/1076802995) and answer the following questions:
- What is the total cost of each option?
- Which option do you recommend to Kevin?
- Can you devise an option better than those two proposed in the case study to minimize total costs?
Problem 4: CASE STUDY: Delivery Strategy at MoonChem (8 Marks)
Read the case study Delivery Strategy at MoonChem on page 321 of the textbook (https://ecu.on.worldcat.org/oclc/1076802995) and answer these questions:
- What is the annual cost of MoonChems strategy of sending full truckloads to each customer in the Peoria region to replenish consignment inventory?
- Consider different delivery options and evaluate the cost of each. What delivery option do you recommend for MoonChem?
- How does your recommendation impact consignment inventory for MoonChem?
Note: The MS Excel file for this case study is available on Assignment 3 Canvas page.
Question 5: Revenue management (8 marks)
For the financial year 2021/22, the operations of the Qantas Group continued to be impacted by the global COVID-19 pandemic. The performance of the Group and individual segments have been compared to the corresponding prior period (financial year 2020/21) and the financial year 2018/19, which represents a proxy for pre-COVID operations. This indicates the degree to which the Groups performance is recovering to pre-COVID levels as the 2018/19 financial year represents the most recent complete financial period not affected by the pandemic. Border restrictions and lockdowns due to both the Delta and Omicron variants of COVID-19 limited mobility and impacted consumer confidence and Group operations throughout the year. This resulted in a Statutory Loss Before Tax for the Group of $1.19 billion. Since the start of the pandemic the Group has lost approximately $25 billion in revenue and accumulated $7 billion in losses. Lockdowns responding to the emergence of the Delta variant of COVID-19 started in July 2021, resulting in the closure of domestic borders for much of the first half.During this period, domestic airlines suffered stranded costs because of the sudden implementation of restrictions. From November 2021, domestic borders were progressively reopened, supported by Australias vaccination program. International borders continued to be closed for much of the first half of 2022, with Australia only reopening in selected states from November. This was the first time Australian citizens were able to freely travel overseas since March 2020. From December 2021, just as travel appeared to be resuming, outbreaks of the new Omicron variant emerged. These became widespread and impacted travel in the third quarter as the uptick in cases delayed re-opening and return to office activities (Qantas annual report 2022). What revenue management strategies do you suggest to Qantas to improve its financial?
Approach to do this assignment
- Use in-text and end-text citations. Use ECU-APA 7th referencing guide.
- To answer the questions and problems, you might use current references (journal papers) between 2019 and 2023. In addition to them, you can use other references like websites.
- The answersto each question or problem should be 300 (10%) words in length (excluding references), so you will need to be concise.
- At the beginning of your answer to each problem or question, write Word count: xx words using the word count function of MS Word.
- At the end of your answer to each question, cite the used references before moving to the next problem.
- Provide specific answers to the questions. You do not need to provide an essay-style report, and there is no need for an introduction, abstract, orsummary. However, your answers should indicate your critical thoughts.
- All the answers to questions should be typed in MS Word.
- You should copy and paste the MS Excel sheets into MS Word showing the solution to problems.
Do not take a screenshot of MS Excel solutions.
- Submit your final document through the Assignment page in Canvas. Please ensure that the final document MUST be in MS Word format.
