PDE1216 Assignment
- Subject Code :
PDE1216
A thermistor is used to measure temperature. An example is presented in Figure
.png)
The electrical resistance of the thermistor changes as the temperature changes. A common temperature measurement system uses a Wheatstone bridge circuit in combination with a differential/instrumentation amplifier circuit (presented in Figure 2). The Wheatstone bridge
is used to convert the resistance change to a voltage change. However, the voltage output of the Wheatstone bridge is generally small in relation to the amount of temperature change, so the differential amplifier is used to increase the overall sensitivity of the system.
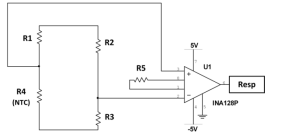
Figure 2 Overall temperature measurment system.
A system based on Figure 2 was implemented to record the breathing signal. Each participants exhalation and inhalation is tracked by the proximity of the temperature sensor to the participant s nose and mouth. Figure 3 showsthe voltage response (breathing signal) changing over time. The participant, a 20-years old woman, was monitored at rest.
Breathing signal monitored at rest using the measurement system block described above based on a thermistor.
Your task
You are required to produce a coherent, concise, well presented and structured report. The following criteria will be considered (rubric is presented in page 4):
1) An introduction to the problem and concepts involved (including thermistors; main applications of thermistors; and why temperature measurements are important in clinical practice) with citations and references to current literature.
2) Characterise the thermistor presented in Figure 1. You will have to: a. Measure the electrical resistance of the thermistor at room temperature (approximately 25C).
b. Measure the electrical resistance of the thermistor at body temperature (approximately 37C). Apply a temperature of ~ 37C to the thermistor by holding the thermistor firmly between two fingers.
c. Based on the measurements a) and b) identify the type of thermistor and explain how it works (with reference to the datasheet).
3) A section describing the data presented in Figure 3 ( please see section Instructions of how import and plot data). You will have to:
a. Calculate the respiratory rate.
b. Identify the signal components and associated time intervals.
c. Compare your results with the current literature.
4) The report presentation should be in a professional style with respect to structure, grammar and spelling.
5) The report content is evidenced with correctly formatted citations and references. You should use the Harvard referencing style, please see
https://www.citethemrightonline.com/
Word count: 1500 words (excluding references).
Instructions of how import and plot data
The instructions below will help you to plot the breathing signal presented in Figure 3. Sampling rate used was 5000 samples/s.
1. Download the BRate.mat file.
2. Create a newscript and copy paste the code below:
clc %clears all the text from the command window
clear %removes items from workspace
close all %closes all figures
st = 1/5000; %sampling time (interval between samples) is calculated as 1/sampling rate
load('BRate.mat') %loads data from BRate.mat file
figure;
plot(BRate(:,1),BRate(:,2)) %Column 1 is time(s) and column 2 is voltage(V) xlabel( 'Time (s)')
ylabel ('Voltage (V)')
3. Save your script (same location as the BRate.mat file) and run the code (Click the Run button on the Editor tab)
