Prepare a Report Using Data Collected by Past Students and Photos of Sites Disturbed by Gravel Mining and Undisturbed Sites
You will prepare a report that assesses the vegetation in an area of woodland that is relatively undisturbed and compares it to vegetation in adjacent woodland that has been, disturbed by gravel mining.
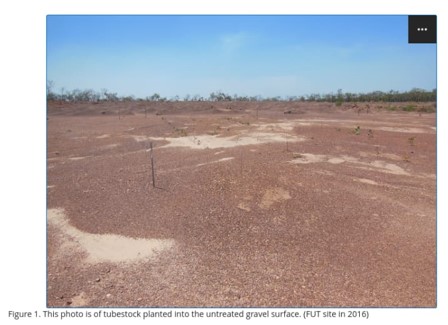
Previous students monitored three replicate 10 m x 20 m plots in both the disturbed and the undisturbed sites (Figure 1). They used a 10 m x 20 m plot to measure tree height, health, diameter, density and composition. Within each plot they used twenty 1 m x 1 m plots to assess shrub density and composition (see the attached Figure 2) and the frequency of Gamba grass, an important introduced grass weed, was also recorded in those twenty quadrats. They also recorded the herb and grass species that were present within five of the 1 m x 1 m quadrats within each plot. In those same five quadrats per plot, they measured the proportion of total herb foliage cover, grass foliage cover, bare ground and litter.
The raw data is provided and needs to be summarised into figures and tables. Use scientific conventions for the presentation of figures and tables, with figure titles below the figures and table titles above the tables. Look at ecological journals and note the presentation of figure titles, axis titles of graphs, table headings, the inclusion of measurement units in column or row headings in tables and on axes in graphs. Note the results text needs to highlight the key findings that are presented in tables and figures.
In the discussion, consider the following three points when discussing the results.
Discuss the variation in vegetation composition and structure between the mined and unmined areas and discuss any implications for rehabilitation success.
Discuss the sustainability of the rehabilitation and any ecological function. (Ecological functional issues would include issues such as pollination, recruitment, hydrology, nutrient cycling, and responses to disturbance, but you would not have information to assess all these issues.)
Select two plant species from the disturbed site and two species from the undisturbed site of vegetation. Discuss the characteristics of the four species qualitatively in terms of whether they have ruderal, competitive and/or stress selected features (see the study guide Topic 7 and the paper by Grime for more information).
Report structure
Introduction
The purpose of the introduction is to highlight important features and issues that are affecting the study and it should focus on local and regional factors rather than global factors. So for Assignment 2. I would expect that bauxite, the cause of the red mud being that it is a by-product of the Bayer process. I would expect red mud to be generally introduced as a harsh medium because of its chemical, physical and biological attributes. I would expect Eucalyptus camaldulensis to be introduced in a paragraph. For Assignment 1, I would expect that the use of models of vegetation development in ecology to be introduced, along with a brief introduction to the disturbance and scenario.
I want the introduction to be succinct and focused on key local or regional issues about the study that an NT environmental scientist would want to know so that they can orientate themselves to key information about the study. Avoid presentation of global issues, unless essential.
A report aim is essential and it is to be concise. It should be clear and comprehensively identify the focus and scope of the study but no more than two sentences.
Methods
Use the video that I have recorded to learn about the methods and to write up the methods section, such that there is sufficient detail for an environmental professional to go and repeat the monitoring using the same techniques.
Results
Firstly, prepare a graph showing the average tree height per plot for trees over 1 metre in height. Two graphs are to be prepared, one for the disturbed site and one for the undisturbed site. They are to be column graphs with three columns/bars representing the three plots for each species (the data for the same species across the three plots are to be grouped together), and all tree species at the site are to be included on the same graph.
Secondly, present the other vegetation and ground cover data as you wish, other than the following requirements.
Tree abundance should be presented as number of plants per hectare. One tree in 200 m2 = 1 x 10,000/200 trees ha-1 = 50 trees ha-1.
Shrub abundance should also be presented number of plants per hectare.
I want the results to show the variation from plot to plot, and other than the graph that is to be presented as has been described, the variation can be presented as either be the values for each of the three plots, or it can be the mean and a measure of variation. Either is fine.
The data I will send out may vary between students. The data I have provided does not need to be referenced.
Discussion
Focus on the three discussion points.
- Effect of disturbance on vegetation structure and composition.
- Implications for ecological sustainability of the rehabilitation.
- Application of the C-R-S scheme of Grime (1979) to the four species.
Are you struggling to keep up with the demands of your academic journey? Don't worry, we've got your back! Exam Question Bank is your trusted partner in achieving academic excellence for all kind of technical and non-technical subjects.
Our comprehensive range of academic services is designed to cater to students at every level. Whether you're a high school student, a college undergraduate, or pursuing advanced studies, we have the expertise and resources to support you.
To connect with expert and ask your query click here Exam Question Bank
