Process Analysis, Mapping and Communication
This session
Process analysis, mapping and communication:
Key process concepts
Making the invisible visible - mapping a cup of tea
Communication diagramming exercise
Learning objective: to understand (some) the basics of processes, the common methods for mapping processes, and the theoretical basis of communicating them.

Process mapping
Process mapping is a systematic/systems approach in documenting the steps/activities required to complete a task.
It involves the inventorying and analysing the processes required to accomplish a goal
There are currently many different techniques used to conduct Process Mapping.
Why model processes?
To show sequence & alternatives
To identify whos involved in the process
To identify resources required for the process
To document existing process
To design new processes
To check shared understanding
To train workers
To form a basis for improvements
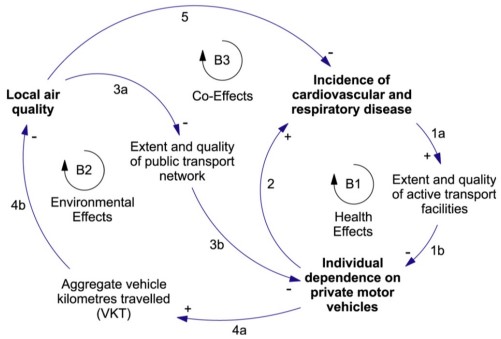
Causal linkages linear relationships
What is connected to what? How to begin thinking about processes.
Try to include relationships that we think are truly causal
When we make an arrow from one element to another, we think we can explain the actual mechanism in the world by which element A cause element B to change.
Causally obvious
Distinct from correlational approach two elements connected vary together in someway, but not necessarily because one causes the other, they are simply associated with one
another.
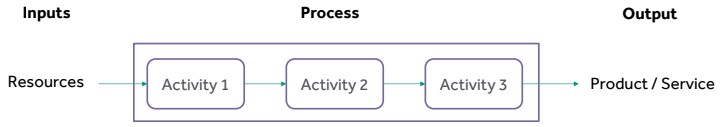
Definition: Process - transforming resources
Products (services) are whatis done
Processes are how something is done
People use processes to produce products
Processes transform a set of inputs into a set of outputs
A process is a systematic series of actions directed towards the achievement of a goal
Process characteristics improvement signifiers
Processes have:
A goal
Specific inputs and outputs
Customers (internal/external)
Rules/procedures to guide and control the use of driving resources and how consumable resources are transformed
Stakeholders/process owners
Have a flow between activities and other processes
Have a capacity (maximum throughput and output)
Have bottlenecks/blockages (unbalanced throughput/output)
Have a performance that can be measured
Diagramming - non-linear relationships
Process analysis, mapping and communication all use diagrams
Diagrams are models a representation of reality or of a possible reality
Diagrams typically represent a way of understanding relationships between elements
Forms of representation range from concrete to abstract
Analogue representations
Schematic representations
Schematic representations
Conceptual representations
Diagramming non-linear relationships
Diagrams are a simplification for a purpose
To convey information to others
To support analysts thinking
To explore and understand a situation
To identify connections
As a basis for quantitative analysis
For diagnosis
For planning and implementation
For communication

Tips for diagramming alone (what youll be doing for the assignment)
Preparation
Allow space and time. Expect to have to redraw as you learn.
Discrimination
Be clear about your purpose for the diagram (use recognised types).
Clarity
Balance clarity and detail as simple as possible but no simpler.
Limit # of elements (7-12) abstract and group.
Explanation
Titles, keys and notes plus accompanying text.
Inspiration looking and thinking
Does it show a feature of the situation you hadnt noticed?
Does it explain behaviour or linkages that had been puzzling?
Does it reveal assumptions you habitually make?
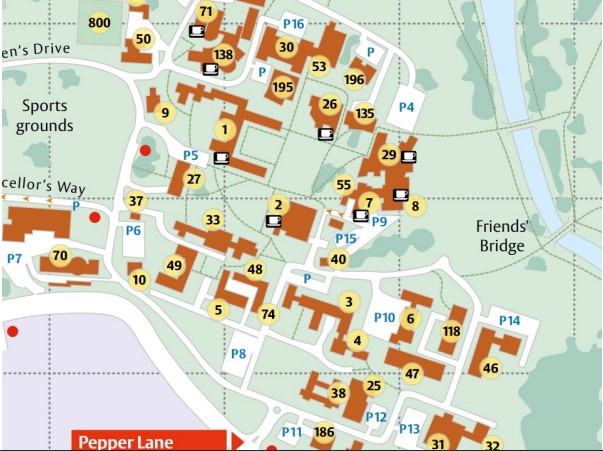
Diagram the desire path exercise
Working alone, produce a diagram (using Miro or draw on paper and upload a photo) that allows you to explore and then communicate something about the exercise:
What you did?
How you did it?
What was the result?
Take ~10 minutes to produce a rough initial diagram
Diagram the desire path exercise
Swap your diagram with your partner, share and discuss your diagrams
How do they vary in content/emphasis?
How do they vary in structure/approach?
Do you understand them without explanation?
Does trying to explain your diagram give you any new insights?
What is missing?
Take ~10 minutes to discuss in pairs
Tips for diagramming in groups (what youll be doing during the module)
Agreement on purpose & product
A shared view - consensus over conformity
Everyone participates
Comments & feedback are part of the process
Constructive, respectful, trusting
Awareness of group dynamics
Propose ideas, seek clarification, provide information, summarise, provide support, be open to ideas
Are you struggling to keep up with the demands of your academic journey? Don't worry, we've got your back!
Exam Question Bank is your trusted partner in achieving academic excellence for all kind of technical and non-technical subjects. Our comprehensive range of academic services is designed to cater to students at every level. Whether you're a high school student, a college undergraduate, or pursuing advanced studies, we have the expertise and resources to support you.
To connect with expert and ask your query click here Exam Question Bank
