Understanding Economic Policies and Impacts in Australia, the US, and Argentina
Question 1.
Part a.
Let's start with the aggregate demand (AD) model and the Phillips curve to understand the expected shifts in the Australian economy. Given the goal of the Reserve Bank of Australia (RBA) to tame inflation expectations and target an unemployment rate of 4.3% by June 2025, the monetary policy response to recent positive shocks will be crucial.
- Aggregate Demand (AD) Model: In June 2023, with an unemployment rate of 3.5%, the economy is likely operating close to its potential output, indicating a relatively high level of aggregate demand. To tame inflation expectations and reduce aggregate demand, the RBA would implement contractionary monetary policy, typically through increasing interest rates. As interest rates rise, borrowing becomes more expensive, leading to reduced consumer spending and investment. Consequently, the AD curve shifts leftward, reflecting lower aggregate demand levels (Lipsey, 2010).
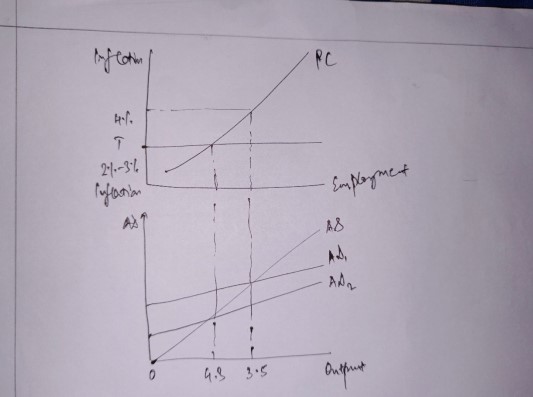
The Aggregate Demand (AD) model diagram illustrates the relationship between the overall price level and the total quantity of goods and services demanded within an economy. It's typically represented as a downward-sloping curve on a graph, with the price level (P) plotted on the vertical axis and the real GDP (or output) on the horizontal axis. The AD curve slopes downwards from left to right, indicating an inverse relationship between the price level and the quantity of real GDP demanded. At higher price levels, the quantity of goods and services demanded decreases, and vice versa (Farmer, 2008).
- Phillips Curve: As the RBA aims to increase interest rates to cool down the economy and reduce inflationary pressures, the Phillips curve suggests that there will be a trade-off between inflation and unemployment. With higher interest rates and reduced aggregate demand, inflationary pressures should ease over time. However, this could also lead to a slight increase in unemployment initially, as businesses cut back on hiring due to lower demand (McLeay, 2020).
The Phillips Curve is a graphical representation that illustrates the relationship between inflation and unemployment in an economy. The Phillips Curve graph typically has inflation rate (%) on the vertical axis and the unemployment rate (%) on the horizontal axis. The Phillips Curve generally slopes downward from left to right, indicating that as unemployment decreases, inflation tends to rise, and vice versa. This inverse relationship implies that there is a trade-off between inflation and unemployment in the short run (Gordon, 2011).
The AD model and the Phillips curve provide valuable insights into the expected shifts in the Australian economy in response to contractionary monetary policy. By understanding these relationships, policymakers can make informed decisions to achieve their macroeconomic objectives of price stability and full employment. In summary, the RBA's contractionary monetary policy will likely lead to a leftward shift in the AD curve, reducing inflationary pressures but potentially increasing unemployment temporarily. This strategy aligns with the goal of achieving a lower unemployment rate of 4.3% by June 2025.
The RBA's May 2024 Statement on Monetary Policy highlights ongoing challenges in managing inflation and economic growth. Despite inflation remaining high, it is declining at a slower pace than anticipated, with services inflation still elevated. Monetary policy is considered restrictive, aiming to balance demand and supply. Economic growth globally and domestically remains subdued, with Australia's major trading partners experiencing similar trends. Labor market conditions are tighter than previously thought, with employment growth remaining positive and wages slightly stronger than expected. Looking ahead, the outlook suggests gradual improvements in economic growth and a return of inflation to the target range of 23 per cent by the second half of 2025. However, uncertainties persist, particularly regarding the pace of inflation moderation and the strength of domestic demand. The RBA's forecasts assume a longer period of higher interest rates to support the inflation target, with risks tilted towards inflation taking longer to return to target, potentially requiring more aggressive monetary policy measures.
Part b.
Let's consider how millennials in their early to mid-30s would respond to upcoming tax cuts and HECS debt relief.
- Tax Cuts and HECS Debt Relief: With steady full-time employment and a significant amount of debt, millennials would likely allocate the extra disposable income from tax cuts and debt relief towards consumption and debt repayment. Increased consumption could stimulate aggregate demand, benefiting the economy. Additionally, reducing debt burdens can improve financial stability and increase future spending capacity. In response to upcoming tax cuts and HECS debt relief, millennials in their early to mid-30s would likely adjust their financial behaviors in several ways. Firstly, they may increase their consumption of goods and services with the additional disposable income. This uptick in spending can stimulate aggregate demand in the economy, potentially leading to higher economic growth and job creation. Increased consumption could also have positive spillover effects on businesses, particularly those in sectors catering to consumer needs.
- Disadvantages Compared to Older Generations: Millennials face several disadvantages compared to older generations who have paid off their mortgage. Firstly, millennials have higher levels of debt, including housing and university loans, limiting their ability to save for retirement or invest in assets like property. Secondly, stagnant wage growth and precarious employment conditions make it challenging for millennials to build wealth compared to older generations who benefited from more stable employment and higher real wage growth. A portion of the extra income would likely be allocated towards debt repayment. Millennials often carry significant levels of debt, including housing mortgages and university loans. By reducing these debt burdens, they can enhance their financial stability and future spending capacity. This debt relief not only eases immediate financial pressures but also frees up more disposable income in the long run for other purposes such as savings or investment.
For many 30-year-olds, credit constraints can be a significant hurdle to achieving their financial goals and aspirations. These constraints can manifest in various ways, impacting their ability to access credit and manage debt effectively:
- Limited Access to Mortgage Loans: Many 30-year-olds aspire to homeownership, but stringent lending criteria and high property prices can make it challenging to secure a mortgage loan. Limited access to mortgage financing may force them to delay homeownership or settle for less desirable housing options.
- High Student Loan Debt: A considerable number of 30-year-olds are still burdened by student loan debt from their undergraduate or graduate studies. High monthly payments on student loans can strain their budget, making it difficult to qualify for additional credit or save for other financial goals like homeownership or retirement.
- Credit Card Debt: Some 30-year-olds may have accumulated credit card debt due to overspending or unexpected expenses. High-interest rates on credit card balances can make it challenging to pay off debt, leading to a cycle of revolving credit and financial stress.
- Limited Access to Small Business Loans: Aspiring entrepreneurs in their 30s may face difficulty accessing financing to start or expand their small businesses. Banks and lenders often require collateral or a strong credit history, which may be lacking for individuals in this age group, particularly if they are still paying off student loans or have limited assets.
- Impact of Economic Downturns: Economic downturns, such as recessions or job losses, can exacerbate credit constraints for 30-year-olds. Reduced income or job instability can make it difficult to qualify for new credit or meet existing debt obligations, leading to financial hardship and potential damage to their credit score.
- Limited Savings and Emergency Funds: Without significant savings or emergency funds, 30-year-olds may struggle to cope with unexpected expenses or financial emergencies. This lack of financial cushion can increase reliance on credit cards or high-cost borrowing options during times of need, further exacerbating their credit constraints.
Moreover, some millennials may choose to invest the extra income in further education or skill development. Investing in education or acquiring new skills can enhance their career prospects and earning potential in the long term. This investment could lead to higher wages, better job opportunities, and increased economic mobility, contributing to their overall financial well-being. Additionally, given the financial challenges faced by millennials, building up savings may become a priority. While some of the additional income may be spent on consumption or debt repayment, others may opt to save a portion of it for emergencies or future expenses. Building a robust savings buffer can provide a safety net against unexpected financial setbacks and contribute to long-term financial security.
In conclusion, while tax cuts and debt relief can provide relief to millennials, they still face significant financial challenges compared to older generations, hindering their long-term financial security and economic prospects. These analyses draw on key economic concepts such as aggregate demand, monetary policy, Phillips curve, consumption behavior, and intergenerational inequality, aligning with the themes covered in the specified modules and articles.
Question 2.
In evaluating the factors at play in the WS/PS (Wage Setting/Price Setting) model concerning unions, worker bargaining power, and productivity in the US economy from January 2021 to January 2024, the provided articles offer crucial insights into the dynamics shaping labor markets and economic performance (zsin, 2017).
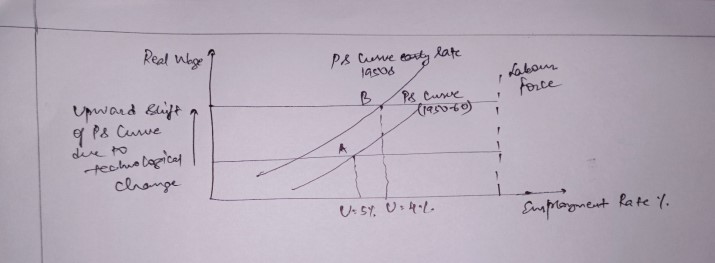
The WS-PS model graph typically has the nominal wage rate (W) on the vertical axis and the level of employment (or output) on the horizontal axis. However, some variations of the model may depict the real wage rate (W/P, where P represents the price level) on the vertical axis instead. The WS curve represents the relationship between the nominal wage rate and the level of employment. It typically slopes upward from left to right, indicating that higher levels of employment lead to upward pressure on wages.
- Unions and Worker Bargaining Power: The articles by Isidore (2023) and Kreidler (2023) highlight the resurgence of unions and their impact on worker bargaining power. Isidore notes that unions are experiencing a resurgence, resulting in significant wage increases for unionized workers. Kreidler suggests that this trend may signal a potential reversal of the decades-long decline in union membership. Conversely, Goldberg (2024) points out that despite rising popularity and power, unions still face challenges, indicating a disconnect between their influence and concrete outcomes.
- Productivity: Purdue's brief on the recent rise in US labor productivity (2024) provides insight into the productivity trends during the specified period. Increased labor productivity can lead to higher wages and economic growth, as workers produce more output per hour worked.
Using the WS/PS model, let's illustrate and explain the US economy's trajectory from January 2021 to January 2024:
- January 2021: At the onset of this period, the economy is grappling with the aftermath of the pandemic, marked by high unemployment and subdued wage growth. The WS curve is downward sloping due to weakened worker bargaining power, reflecting high unemployment rates. Meanwhile, the PS curve may also be negatively impacted by uncertainties and reduced demand, leading to subdued wage-setting power for firms.
- 2021 to 2023: The resurgence of unions and increased worker bargaining power, as highlighted by Isidore and Kreidler, leads to upward shifts in the WS curve. As unions negotiate higher wages for their members, the equilibrium wage level rises, contributing to increased consumer purchasing power and aggregate demand. However, challenges faced by unions, as indicated by Goldberg, may moderate the extent of these shifts (Piluso, 2021).
- 2023: Major strike activity, as reported by Poydock and Sherer (2024), further boosts worker bargaining power, causing additional upward shifts in the WS curve. These strikes could lead to labor market disruptions, pushing wages higher. Meanwhile, rising labor productivity, as reported by Purdue, contributes to the upward movement of the PS curve, allowing firms to afford higher wages without significantly increasing prices (Rievajov, 2016).
- January 2024: By this point, the economy has seen notable improvements in both labor market conditions and productivity. The WS/PS model suggests that the equilibrium wage level has risen, reflecting stronger worker bargaining power, while prices have remained relatively stable due to increased productivity.
In summary, the period from January 2021 to January 2024 in the US economy witnessed significant shifts in the WS/PS model driven by the resurgence of unions, improvements in worker bargaining power, and rising productivity levels. These dynamics have likely contributed to higher wages for workers without significant inflationary pressures, leading to a more balanced and robust labor market.
Question 3.
In analyzing the fiscal policy undertaken by Argentina's President Javier Milei, who aims to shrink the role of government and exterminate high inflation, we can utilize the multiplier Aggregate Demand (AD) model. This model illustrates the impact of changes in government spending or taxation on the overall level of economic activity, assuming a closed economy.
Initial Conditions (2023): In 2023, Argentina's economy is facing significant challenges, including high inflation and economic instability, as highlighted in the provided articles. The economy may be operating below its potential output due to these macroeconomic imbalances.
Multiplier AD Model: With Milei's austerity measures aimed at reducing government spending and intervention in the economy, there is a contractionary fiscal policy stance. This implies a decrease in government expenditure (G), leading to a leftward shift in the AD curve.
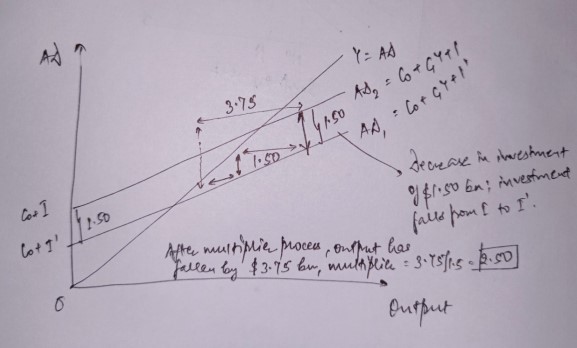
o The multiplier effect magnifies the impact of changes in government spending on overall economic activity. Assuming a high marginal propensity to consume (MPC) of 0.8, the initial decrease in government spending leads to a decrease in aggregate demand (Colander, 2017).
o As a result of the decrease in aggregate demand, there is downward pressure on output levels and employment in the short run. Firms may experience reduced sales, leading to lower production levels and potentially layoffs.
o The decrease in government spending also affects consumption and investment levels through the multiplier effect. With reduced government expenditure, households and firms have lower incomes, leading to lower consumption and investment spending (Baqaee, 2022).
o Over time, the multiplier process unfolds as the initial decrease in government spending ripples through the economy, resulting in further rounds of reduced consumption and investment, further decreasing aggregate demand.
o By the end of 2024, the Argentine economy may face significant economic contraction, characterized by lower output levels, increased unemployment, and reduced consumer and business confidence. The shrinkage of government's role, coupled with efforts to combat inflation, may exacerbate economic challenges, as highlighted by the articles reporting plunging economic activity and widespread protests against austerity measures.
In summary, the multiplier AD model illustrates the expected outcomes of Milei's fiscal policy on the Argentine economy. While aiming to exterminate high inflation, the contractionary fiscal measures may lead to a downward spiral in economic activity, highlighting the complex trade-offs involved in implementing austerity measures in an attempt to stabilize the economy (Benigno, 2015).
Are you struggling to keep up with the demands of your academic journey? Don't worry, we've got your back!
Exam Question Bank is your trusted partner in achieving academic excellence for all kind of technical and non-technical subjects. Our comprehensive range of academic services is designed to cater to students at every level. Whether you're a high school student, a college undergraduate, or pursuing advanced studies, we have the expertise and resources to support you.
To connect with expert and ask your query click here Exam Question Bank
