Applied Statistics for Business and Economics STA302
- Subject Code :
STA302
Part B
Task 1.
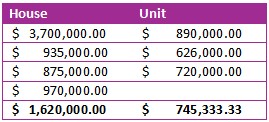
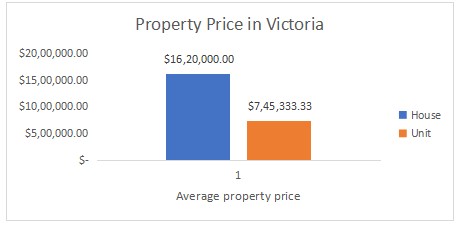
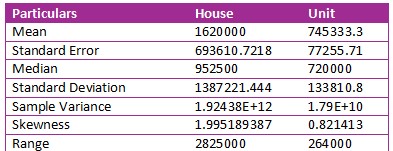
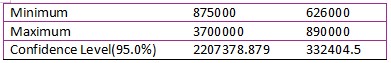
The sales data for houses and units in Victoria show differences in their sale prices. Houses have a mean sale price of $1,620,000 which is higher to average value of $ 745,333. 33 average for units. This has shown by the fact that the highest house price is $3,700,000 while the highest unit price is $ 890,000. This implies that houses have a higher price tag compared with units, and this could be as a result of the difference in size, location and the kind of amenities that come with the properties. However, when comparing these averages from the normal distribution point of view it appears that the differences may not be very far apart, even though the observed differences can be actual; there might be a degree of chance to the differences.
Task 2.
Task 3.
Anova
SUMMARY
Statistical Analysis Summary
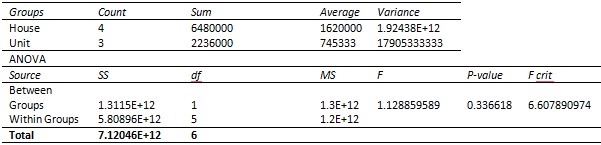
In order to assess whether the mean sale prices of houses and units in Victoria have a significant difference the ANOVA test was conducted. In this case, H? is used to hypothesize that the population mean of sale prices of houses is equivalent to the population mean of sale prices of units while H? proposes that the population mean of sale prices of houses is different from the mean of sale prices of the units.
As reviewed from the ANOVA results used in this study, an F-statistic of 1 was obtained. 24 and p-Value = 0. 337. The F-critical value, that determine the significance level of the results, is equal to 6.608. Since the calculated F-statistic is equal to 1.129 which is far lesser than the F-critical value and p-value equal to 0.337 which is greater than the significance level of 0. Otherwise, if p < ? which is the case in our 05, does not allow us to reject the null hypothesis. This means that, the differences, observed in the mean sale prices between houses and units, are not practically significant.
Consequently, average price difference appears apparent with houses averaging at $1,620,000 against $745,333.33 for unitsour statistical test used as part of our analysis does not produce enough force to support hypotheses which indicate that there is a difference in the mean sale prices. In this way, the differences which have been found may be by virtue of random variation rather than as an outcome of a true effect.
Task 4.
The ANOVA test carried out to test the null hypothesis that the mean sale prices of houses and units in Victoria is the same yielded an F-statistic of 1. 122 and the p-value of 0. 337. The partial F-Table refers more to chi-square tests and the critical F-value for this test is 6. 608. Since the obtained F-statistic is less than 2 and far from the critical value while the p-value is greater than 0. 05, we do not have sufficient evidence which would allow us to reject the null hypothesis.
As for the null hypothesis, it stated that the mean of sale prices of houses and units are equal while Murthy (2014) defined the alternative hypothesis as there is a significant difference in the mean sale prices of houses and units. According to the findings obtain from the analysis, it can be concluded that there is no enough evidence that would support the not equal hypothesis or statement at a 0.05 level of significance. Particularly, the F-statistic equaled 1. 129 is less than the below cut off value, hence the variation in sale prices of the two types of properties cannot be said to be significantly different.
Houses have sold at an average price of $1,620,000 and, units at $ 745,333.33 figures that suggest that the houses have been sold at an average price higher that the units However, the statistical difference is not evident here. This result mean that even though sale prices of houses are generally higher, this may not be true mean difference that could be the sample sizes are flukes.
In practical terms, this means that even with the current data it is possible not to reject the null hypothesis that there is no significant difference in the mean sale prices of houses and units in Victoria. Hence, although we can observe a difference in averages, we cannot point to how much is enough for a practitioner to claim that the difference makes the results statistically significant. It is again noted that while these findings have provided an initial assessment of attitudes in the sample, trends which may emerge in subsequent analysis require further exam with increased reliability and precision that can be obtained from larger sample size and additional data.
Part C
Task 1.
Task 2.

Task 3.
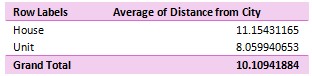
Sheet 9 offers a contrast of the average land sizes the houses and units which the graphic reveal the tendencies of the typical house and unit property dimensions. SZ houses average land area is 585 sqm. 63 square meters as for the units it ranges 363. 62 square meters. The gross mean plot size with both property types is 528. 62 square meters.
The key features of the graphic indicate that house are larger in size of acreage than the units. This is quite a characteristic, which brings out the common spatial restraints and property layouts, to the respective type. Thus, larger average size of the land for the houses shows that these properties are probably more extensive, which are possibly reflected in higher average prices of the houses. On the other hand, the disparity in the size showing that the land under each unit is considerably smaller puts another view that one could be living perhaps a more urban lifestyle.
Altogether, the differences in the sizes of houses and units are well depicted in the graphic whereby the area of land a house gets is larger than that of a unit. It will therefore be important to distinguish between those variables that are likely to have an impact on property values and the variables that could affect the preferences of market share in the real estate business.
Are you struggling to keep up with the demands of your academic journey? Don't worry, we've got your back!
Exam Question Bank is your trusted partner in achieving academic excellence for all kind of technical and non-technical subjects. Our comprehensive range of academic services is designed to cater to students at every level. Whether you're a high school student, a college undergraduate, or pursuing advanced studies, we have the expertise and resources to support you.
To connect with expert and ask your query click here Exam Question Bank
