Assessment Brief: BUS1003 Mathematics and Statistics
Assessment 1: In-class Tests
Assessment Overview
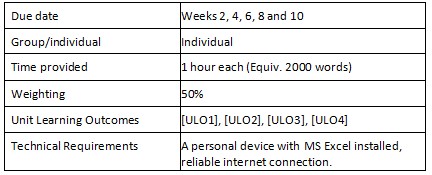
Assessment 1 consists of 5 in-class invigilated tests. You will receive a passcode to access the assessments on the day of the test.
Please ensure that you have a device (personal laptop) with wi-fi or reliable mobile internet connection. You are not allowed to leave the test room until you submit, and you cannot complete the assignment using your phone.
The purpose of each test is to assess your understanding of the concepts covered in the course and your ability to apply technical skills to solve statistical problems. You will be provided with downloadable MS Excel spreadsheets for each assessment and are required to complete the calculations on those sheets.
NOTE: Do not insert answers into cells as values, your assessor needs to see the functions you have used to arrive at the answer. If there are no functions displayed in corresponding cells, the answers will not be marked.
Assessment Marking
Each test is marked out of 10 points and is worth 10% of the total of Assessment 1. See the rubric for the marking criteria.
Assessment 2: Investigation
Assessment Overview
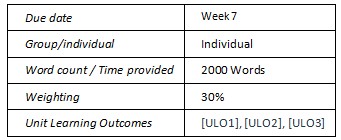
For BUS1003 Assessment Task 2, you will undertake an individual investigation. This will be in the form of a written report that presents and analyses data in relation to the Australian Labour Force for a given period.
Timeframe and Submission
The assessment must be uploaded no later than (17/11/2024) 11:59 pm (Sunday of Week 7) through Canvas. Unless approval for an extension is given on medical grounds (supported by a medical certificate), there will be a penalty of 5% of the maximum marks per calendar day for a late submission of the assignment. This task is to be completed in your own time (out of class).
Assessment Details
Your answers must be presented in a report format and the sections of the report need to be clearly labelled with appropriate headings. You need to submit two files for this assessment: 1) a report (MS Word format) and 2) an MS Excel file showing your dataset and other requirements relevant to each task.
When asked to perform a calculation, you must show all the workings either using formulas by hand or MS Excel. This must include intermediate steps where relevant. Failure to do so will result in a loss of marks.
An Assessment Declaration is required and must be attached as the cover page of your assignment.
NOTE: Formulas generated by AI will not be accepted.
Investigation: Australian Labour Force 2020-2022
Historical data is pivotal in making decisions for the future. In this assignment, you will work with historical data from the COVID19 pandemic years.
You have just accepted a job in Workforce Australia, the Australian Government Department of employment and workforce, as a data analyst. Between 2020 and 2022, the COVID19 Pandemic significantly affected the structure and composition of the Australian labour force. Write a report about the Australian labour force for the above-mentioned period and provide insights which can assist the department in making informed decisions for the future. For this report, Work Force Australia requires the following information:
Requirement 1
a. The total unemployment and participation rates for each state and territory in Australia from 2020 to 2022.
b. A breakdown of the total unemployment and participation rates based on age groups and gender groups for each state and territory in Australia.
Requirement 2
a. The total full-time and part-time employment (seasonally adjusted) for each state and territory in Australia from 2020 to 2022.
b. A breakdown of the total full-time and part-time employment (seasonally adjusted) for hours worked in all jobs and underemployment for each state and territory in Australia.
As a statistical analyst, you are required to collected, organise, analyse, and present data relevant to the above requirements. Your analysis would support Work Force Australia in making strategic decisions for the management of the Australian labour force.
Sections of the report
Introduction: Provide a brief description of the Australian labour force and outline the importance of analysing data pertaining to the Australian labour force.
Presentation of data: As a data analyst it is your job to organise information in a way that is easy to follow. Prepare tables to show the data for each requirement in different sheets in an MS Excel file. Ensure that the sheets and data are clearly labelled.
Graphical presentation of data: In your report, choose suitable graphs to illustrate the presented data for both Requirements 1 and 2 above. Explain why you selected those visual aids.
Interpretation of data: Use your graphs from the previous section to discuss Australian labour force trends (in terms of total unemployment and participation rates) for 2020, 2021 and 2022 for each state and territory in Australia.
Calculations: Calculate the mean and the standard deviation of the presented data for Requirement 2a for 2021 and 2022.
Probability analysis: Calculate the probability of unemployment based on age groups and gender groups for each state and territory in Australia and decide which age group and gender group could be faced with higher risk of unemployment and why.
Comparative analysis: Compare the participation rates for ACT, NSW, VIC, QLD, SA, WA, and TAS in 2021. Explain which state has the highest and which the lowest participation rate in the Australian labour force, taking into consideration age and gender.
Important websites
Workforce Australia, Department of Employment and Workplace Relation
Australian Bureau of Statistics
Assessment Marking
The assessment will be marked out of 100 and weighted at 20% of the total mark of the unit. See the rubric for the marking criteria.
Assessment 3: Statistical Data Analysis
Assessment Overview
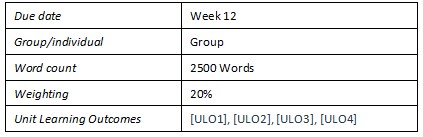
The BUS1003 Assessment Task 3 is a group assignment. You are required to conduct a statistical data analysis using a dataset provided.
Timeframe and Submission
The assessment must be uploaded no later than 1:00 pm on Friday of Week 12 (20/12/2024) through Canvas. Unless approval for an extension is given on medical grounds (supported by a medical certificate), there will be a penalty of 5% of the maximum marks per calendar day for a late submission of the assignment. You will complete the task in your own time.
An Assessment Declaration is required and must be attached as the cover page of your assignment.
Assessment Detail
Your answers must be presented in task number order and be clearly labelled. Answers to each task must start on a new page.
Your assignment must be submitted as a MS Word or PDF file. Copy and paste any relevant MS Excel outputs to this document before any relevant written answers to each task. You must highlight relevant items on any required Excel outputs and refer to them in your written answers.
NOTE: If you are unfamiliar with the MS Word Equations Editor, you may use algebraic/mathematical/statistical symbols and notations in neat handwritten form.
Screenshots of AI generated calculations will not be assessed.
Before commencing this assessment, you will need to download the Dataset file from CANVAS (Assessment 3).
When asked to perform a calculation, you must show all workings either using formulas by hand or the correct formulas in MS Excel. Formulas generated by AI or calculated using AI will not be accepted. When MS Excel is used, you must submit the Excel file, too. This must include intermediate steps where relevant. Failure to do so will result in a loss of marks.
Set-up
The dataset included with this assignment is a random sample of 450 people and their salaries from the population survey of Australia in a particular year (2020). You need to select random samples of 100 IDs, each containing observations, where appropriate, of the eight variables, V1 to V8. The variables in the dataset are as follows:
V1 = Salary (dollars per hour)
V2 = Occupational category (1=Management, 2=Sales, 3=Clerical, 4=Service, 5=Professional, 6=Other)
V3 = Sector (0=Other, 1=Manufacturing, 2=Construction)
V4 = Indicator variable for Residency Ownership (1=Homeowner, 0=Tenant)
V5 = Educational level (0= other, 1= Diploma, 2= Graduate Certificate, 3= Bachelor, 4=Master, 5= Doctorate)
V6 = Number of years of work experience
V7 = Age (years)
V8 = Indicator variable for sex (1=Female, 0=Male)
Assessment Task
Answers must be based on the sample data file you created in Set-up, and which should be presented in a MS Excel file. In addition, most tasks in Assessment 3 require you to obtain an MS Excel output before performing analyses. There are five tasks in Assessment 3. You must meet all task requirements to receive full marks.
Task 1 (20 marks)
a. Find the frequency distribution for the Educational Level (0= other, 1= Diploma, 2= Graduate Certificate, 3= Bachelor, 4=Master, 5= Doctorate). Use MS Excel to produce a Descriptive Statistics table for your sample "Educational level" data and paste it into your MS Word assignment document.
b. Use the relative frequency approach to find the probability distribution for the Educational Level.
c. Draw a pie chart for the probability distribution of the Educational Level.
d. Define the probability distribution based on part (b) (You must calculate using your data). Show your results in the format below:
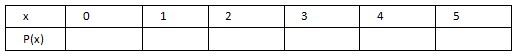
e. Based on the probability distribution calculated in the previous section (d), complete the following:
I. Find the probability of exactly two.
II. Find the probability of more than three.
III. Find the probability of at least three.
Task 2 (20 marks)
a. Find the frequency distribution for the indicator variable for Residency Ownership (1=Homeowner, 0=Tenant). Then, use MS Excel to produce a Descriptive Statistics table for your sample "Residency Ownership" data and paste it into your MS Word assignment document.
b. Use the relative frequency approach to find the probability distribution for the Residency Ownership.
c. Draw a bar chart for the probability distribution of the Residency Ownership.
d. According to a sample data report, 26% of people are the homeowner (you need to consider the Residency Ownership proportion as the probability of success). Assume that a sample of 8 people is studied:
I. Find the probability of exactly five are a homeowner.
II. Find the probability less than five are a homeowner.
III. Find the probability that at least six are a homeowner.
Task 3 (20 marks)
a. Use MS Excel and your sample data file to produce a suitable output; test, at the 5% level of significance, that the hypothesis for the mean of Salaries (dollar per hour) in the population is $25.
b. Write, in precise symbolic form, the null and alternative hypotheses.
c. Is this a one-tailed or two-tailed test? Briefly explain the reasoning behind your answer.
d. Define z-test and calculate the value of test statistics.
e. Calculate critical values based on the nature of the problem.
f. Find a 95% confidence interval for Salaries (dollar per hour) in the population.
g. Make the decision based on the critical value.
Task 4 (20 marks)
a. Use MS Excel and your sample data file to produce a descriptive summary output (remember to include confidence bound "e" at 1% level of significance) for the indicator variable for sex (1=Female, 0=Male) according to your sample data from Task 1.
b. Define the mean proportion.
c. At a 1% level of significance, the hypothesis for the indicator variable for sex (1=Female, 0=Male) according to your sample data from Task 1 and the mean proportion for the male population is 0.45.
d. Write, in precise symbolic form, the null and alternative hypotheses.
e. Is this a one-tailed or two-tailed test? Briefly explain the reasoning behind your answer.
f. Provide a conclusion based on the sample evidence.
g. Find a 99% confidence interval for the indicator variable for male.
Task 5 (20 marks)
a. Find the relationship between Salaries (dollar per hour) as a response variable and Education Level as an explanatory variable. Use MS Excel to find the linear regression output. The belief is that as the education level increases, the salaries (dollar per hour) would increase. (You must use your dataset to calculate.)
b. State the slope coefficient of the least squares regression equation.
c. State the intercept coefficient of the least squares regression equation.
d. Determine the least squares regression equation representing the approximately linear relationship between the Salaries (dollar per hour) as a response variable and Education Level as an explanatory variable.
e. Estimate the Salaries when the Education Level is Diploma.
f. Construct the 95% confidence interval for the slope parameter of the least squares regression equation.
Assessment Marking
The Statistical Data Analysis assessment will be marked out of 100 and weighted at 30% of the total unit marks. See the rubric for the marking criteria.
Are you struggling to keep up with the demands of your academic journey? Don't worry, we've got your back!
Exam Question Bank is your trusted partner in achieving academic excellence for all kind of technical and non-technical subjects. Our comprehensive range of academic services is designed to cater to students at every level. Whether you're a high school student, a college undergraduate, or pursuing advanced studies, we have the expertise and resources to support you.
To connect with expert and ask your query click here Exam Question Bank
