Body Mass Index (BMI) Calculation and Graphing ENG4002 Assessment
- Subject Code :
ENG4002
- University :
Harvard University Exam Question Bank is not sponsored or endorsed by this college or university.
- Country :
United Kingdom
Matlab Coursework
Answer five Questions only the first one is compulsory
What to Hand In:
- Write the Matlab code for each Question you wish to answer and name it as Question_x.m (where x is the question number example, 1, 2, 3 ).
- After you have done the codes to five questions, then integrate them into one m file and call the file name as:
FirstName_SurName_UBxxxxxxxx.m
Your m-file FirstName_SurName_UBxxxxxxxx.m should be presented using the following format.
clear all
close all
% Question 1
Copy the code from Question_1.m here.
clear all
close all
% Question 2
Copy the code from Question_2.m here.
clear all
close all
% Question 3
Copy the code from Question_3.m here.
..
..
.
clear all
close al
% Question XX
Copy the code from XX here.
Remember you have to answer only five questions.
Marking:
Full marks are awarded:
- If you document the Matlab code you created. Use the percent symbol (%) to add comments that explain the purpose and syntax of each command you have used (if a function is used more than once you do not need to document it again).
- If, whenever possible, you investigate at least one alternative way of solving a question: Often, there is more than one way of coding a solution. Try to explore alternative coding.
- If your m-file is error-free. Make sure your code runs before submitting Marks will not be awarded for the code after the line where the runtime error occurs.
Marking Scheme: |
|||||||||||||||
Question 1 20% |
Question 2 20% |
Question 3 20% |
Question 4 20% |
Question 5 20% |
Question 6 20% |
Question 7 20% |
Question 8 20% |
||||||||
Main Code |
15 |
Main Code |
15 |
Main Code |
15 |
Method 1 |
10 |
Method 1 |
10 |
Main Code |
15 |
Main Code |
15 |
Main Code |
15 |
Comments |
5 |
Comments |
5 |
Comments |
5 |
Method 2 |
5 |
Method 2 |
5 |
comments |
5 |
comments |
5 |
comments |
5 |
Comments |
5 |
Comments |
5 |
||||||||||||
Total Mark 100% for Five Questions. |
|||||||||||||||
Question 1: 20 points
The sensor HAR (human activity recognition) through a mobile device was used to create the human activity data set. The observations of five different physical human activities: Sitting, Standing, Walking, Running, and Dancing, are collected in which 60 features extracted from acceleration data measured by smartphone accelerometer sensors for each observation. The human activity data set is stored in humanactivity data file. You can simply load the file by typing the matlab statement load humanactivity. Write the Matlab code to achieve the following:
- Compute the confidence matrix and the accuracy for the following classifiers:
- K Nearest Neighbour (KNN)
- Discriminant Analysis (DA) and
- Decision Tree (DT)
- Plot the response vector IDs for 5000
- List the last 10 activities names stored in the data
- Plot the 60 features for the data observations number 4 and
- Scatter plot with grouping variable of features 5 and
- Prepare the training and test data uses 90% and 10% of the data
Question 2: 20 points
A sample data from the patients.mat file within the Matlab library is shown in Figure Q1-1. This consists of a table with the list of LastName, Gender, Age, Height, Weight, Smoker, Systolic, Diastolic.
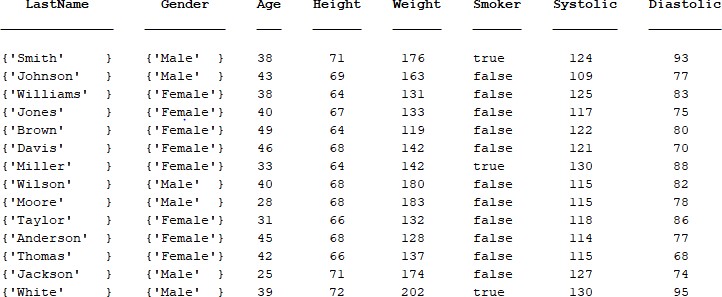
Figure Q1-1, Samples of the data stored within the patient.mat file.
Write a code to read the data file and compute and show the following:
- List the male smokers and then the female smokers
- Compute the average height and weight for the male and then female
- Find the patient's names when their Systolic level is bigger than or equal
- Compute BMI (Body Mass Index = BMI = W / H2 (kg/m2)). Remember the weights are given in pounds and the heights in inches. Note 1 pound = 0.453592 kg, and Inch = 0.0254 meter.
- Integrate the BMI within the Patient
Question : 20 points
The following chart in Figure Q3-1 describes the correlation between the height and the weight of a person and how this could be related to define Body Mass Index.
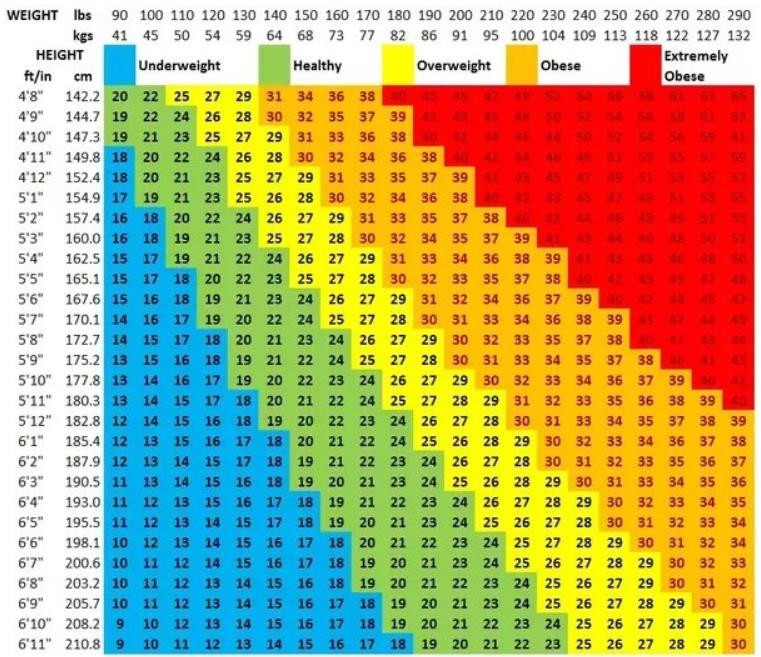
Figure Q3-1. The correlation between the height and the weight of a person
The formula used to calculate the BMI = W / H2 (kg/m2), where W is the weight in kg and H is the height in meters. Use this formula to plot the following graph shown in Figure Q3-2.
Figure Q3-2. The BMI graph requested by Question 2.
For the four colour curves use the line width 3. To display a BMI of a person use the following: circular MarkerSize 8, MarkerEdgeColor black, and MarkerFaceColor cyan. To display this you have to enter two values. These are the Height in meters and Weight in kgs. And inform the outcome result to the person from the command window
Question 4: 20 points
The concentration (C) of insulin in the body is described by the following equation,
C = C0e-40t / M
Where
C0 = 85 pmol/L is the initial insulin concentration, t is time in minutes, and M is the person mass in kg.
- Write a code that will calculate the insulin concentration of two people with weights of 60 Kg and 100 Kg. Simulate the insulin concentration for 4 minutes in steps of
0.1 minute.
2. Plot the insulin concentration of the two people on the same graph. For the first curve plot a magenta solid line, square marker, cyan for MarkerFaceColor, and MarkerSize of For the second curve plot a black dashed line with LineWidth of 2.
3. Your plot should have a title, a legend, and appropriate labels for the x and y
Your plot could look like this:
Question 5: 20 points
The paper cup shown below has Radius R2 = l.5R1, height h, volume V = 716 cm3, and surface area S. The height, volume, and surface area of the cup are given by:
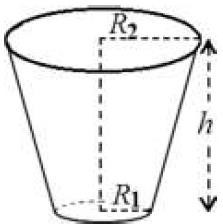
?h(R2+R2+R1R2)
V = 1 2
3
S = ? R2+ ? (R1+R2)?(R2 ? R1)2 + h2
Determine R1, R2, and S of the paper cups with heights h = 8, 10, 12, 14, and 16 cm
- Method 1: Simulate Equations without using a for
- Method 2: Simulate Equations using a for
Display results to the screen tabulated as shown below:
For example as:
h |
R1 |
R2 |
S |
8 |
4.24 |
6.32 |
332.25 |
10 |
3.79 |
5.69 |
348.51 |
12 |
3.46 |
5.2 |
367.48 |
14 |
3.21 |
4.81 |
387.18 |
16 |
3 |
4.5 |
406.83 |
Or alternatively, you may display as:
Height |
Radius R1 |
Radius R2 |
Surface S |
8 |
4.24 |
6.32 |
332.25 |
10 |
3.79 |
5.69 |
348.51 |
12 |
3.46 |
5.20 |
367.48 |
14 |
3.21 |
4.81 |
387.18 |
16 |
3.00 |
4.50 |
406.83 |
Hint: You may need to transpose the vectors before printing to the screen.
Question 6: 20 points
Develop a Matlab code to read, compare and make decisions with the following steps:
- Create a string variable and assign to it your favourite
- Write Matlab code that prompts the user to guess your favourite colour. After the user has had 3 attempts, the program displays the message "Incorrect. You run out of chances!" and stops.
For example, let's assume you set your favourite colour as blue, when you run your code the output could look like this:
>> Guess my favourite Color: re
Incorrect: Try again
>> Guess my favorite Color: yellow
Incorrect: Try again
>> Guess my favourite Color: gree
Incorrect: You run out of chances!
Another scenario:
>>Guess my favourite Color: blue
Your guess is correct: Good Guess!
Note: make sure the code is not sensitive to small and capital letter
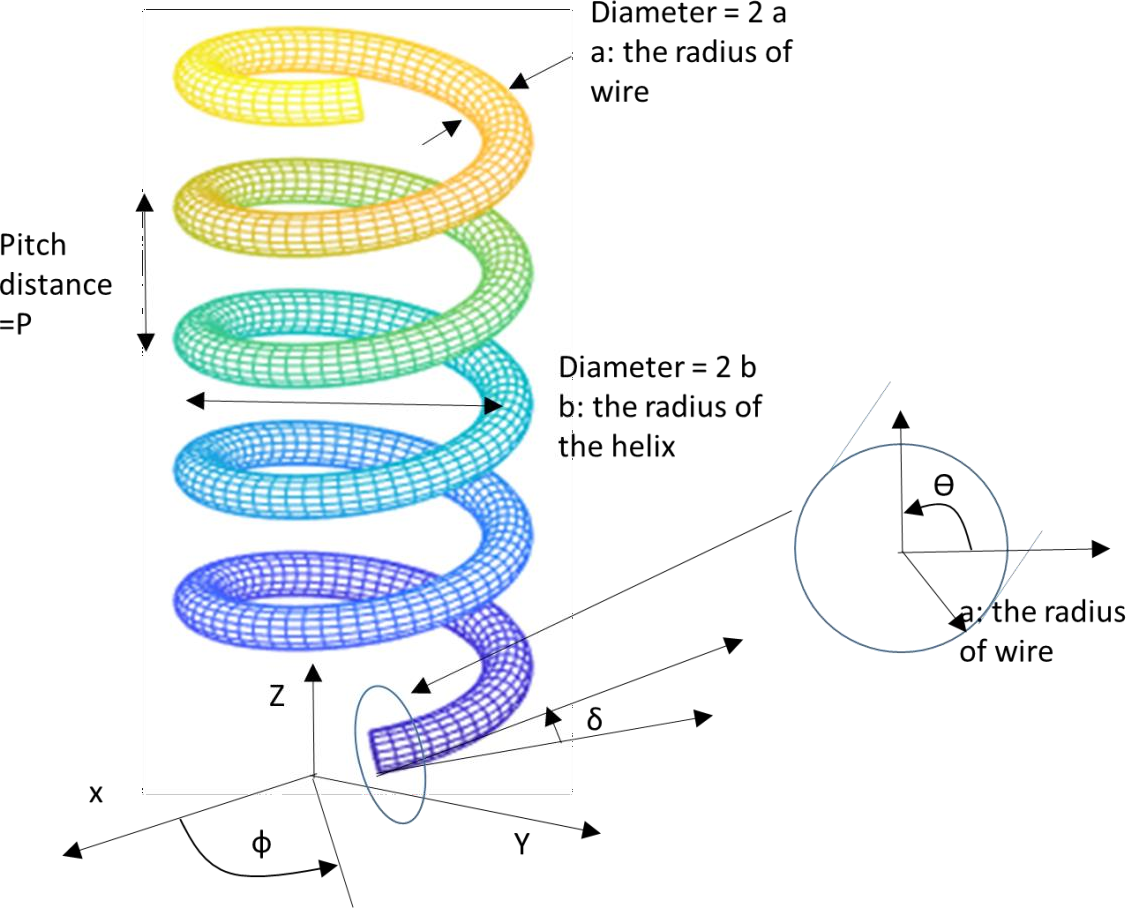
Write a Matlab code to plot the 3D image of the helix below:
Use the following parameters and equations that define the axes in 3D:
p=0.199; Pitch distance (distance between the turns)
a=0.02999500; Radius of the helis wire
b=0.191; Radius of the helix
n = 5, is the number of helis turns.
? = atan(p/(2*pi*b)); The pitch angle x
= b + a cos(?
y = -a sin(?) sin(?)
x = x sin(?)+y cos(?);
y =-x cos(?)+y sin(?);
z = p*?/(2*pi)+a*sin(?)*cos(?);
Question 8: 20 points
(a) Find the best estimate of the order and coefficients of the polynomial for the following data file name:
xy_data.mat
State clearly why you selected this polynomial function and plot the data and fitting function/s.
Note: You are allowed to use either direct Matlab code or the Curve Fitting APP.
(b) Write a Matlab code to find the value of x that satisfies the following equation:
1 -
x +1
d (x.sin(x)) - 2e-
|
dx 0
x/100 = 0
Assume the value of x between 0 and 5 only.
