Introduction to Process Improvement Approaches
This session
Learning objective: to understand the commonly used process improvement approaches
Session 1:
Process management and process change / improvement
Session 2:
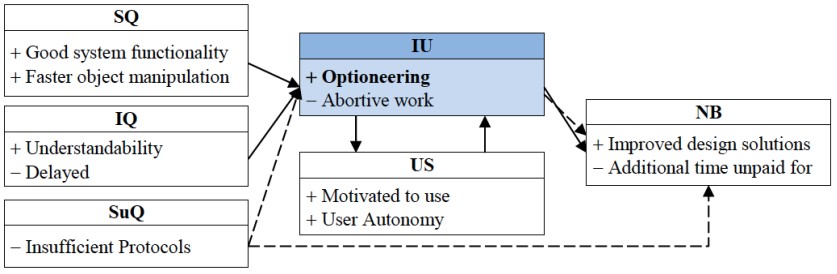
Process improvement Implementing information systems: a case study
Next session: Lean construction case study
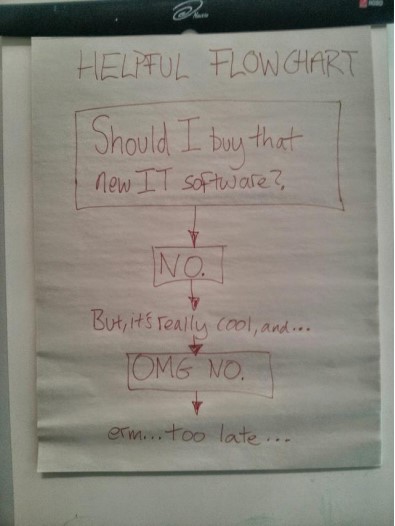
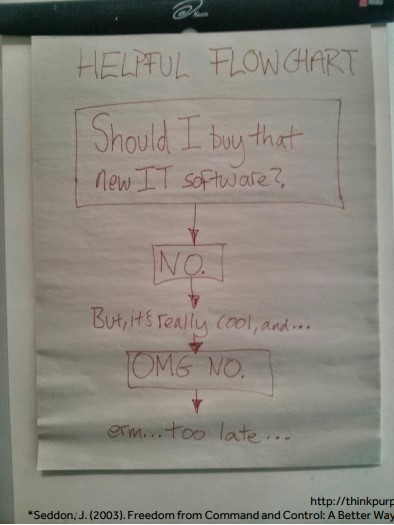
The eternal struggle between light and dark??

Types of process improvement
What do we mean by process improvement?
Why are we improving the process?
Implementation triggers
Who benefits? The organisation, the process, or the client?
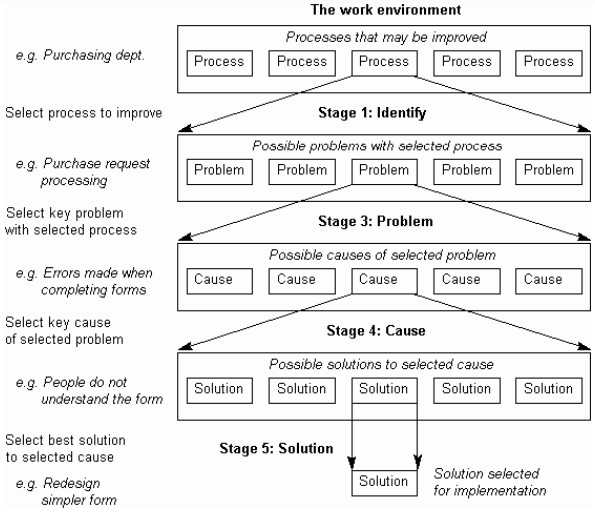
How do we determine which process to improve?
Depends on who benefits?
How, or even can, we determine where the improvements will lead?
Implementation models

Process production philosophies
Manage processes not functions
Focus on improving performance of complete process rather than individual departments
Trying to avoid functional silos
Functional performance is taken as a given value is in improving overall flow
In a production flow, products* are:
Processed, Moved, Inspected, Waiting
* includes goods, information etc.
Specific philosophies (1)
Just-in-Time Production (JIT) / Toyotism - (1950s)
Continuous improvement quicker and more efficient moving and less waiting
Total Quality Management (TQM) (late 1980s / early 1990s)
Reduced inspection , reduced re-work through increasing quality of materials/inputs
Business Process Re-engineering (BPR) (1990s) Hammer and Champy
Organisational transformation based on new strategy driven by customer focus
Vertical to horizontal re-organisation
Lean Production (1990s) ...
Specific philosophies (2)
Lean Production
All activities analysed to see if they add value (convert a product from one state to another) or not
Conversions and flows should be managed differently
Conversions should be made more efficient
Flows should be eliminated
In complex production systems address the value stream for the whole process

Continuous improvement vs. reengineering
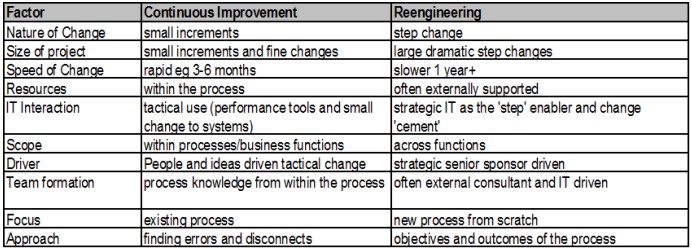
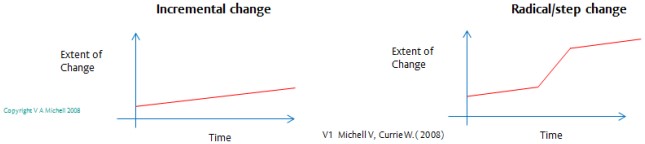
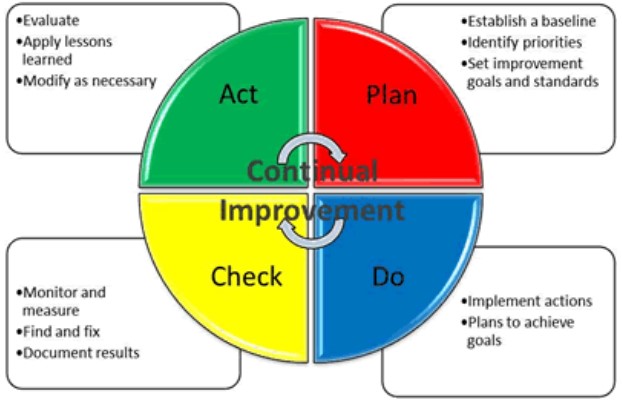
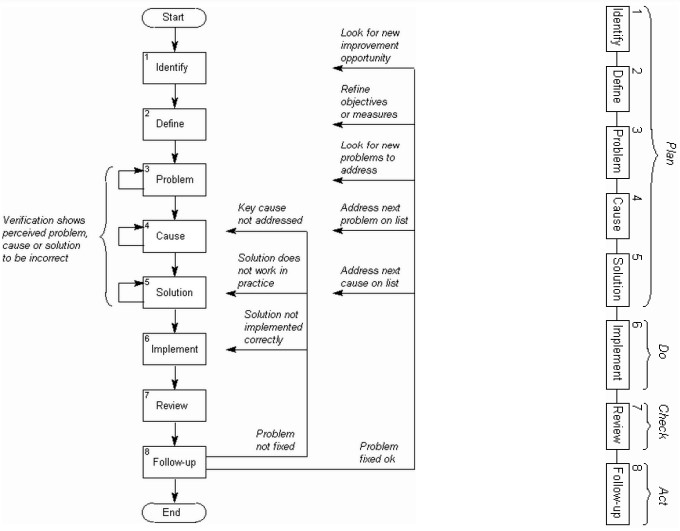
Demings Plan-Do-Check-Act model (incremental)
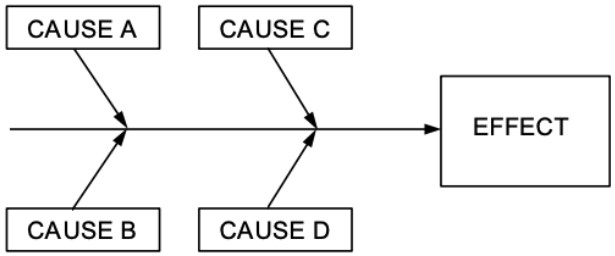
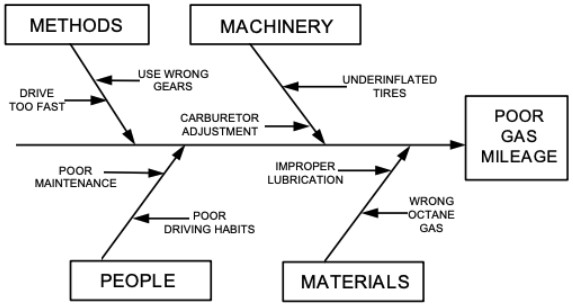
Cause and effect diagramming
A graphic tool that helps identify, sort, and display possible causes of a problem or quality characteristic.
Helps determine root causes
Encourages group participation
Uses an orderly, easy-to-read format
Indicates possible causes of variation
Increases process knowledge
Identifies areas for collecting data
Ishikawa fishbone diagram
Basic layout of cause and effect diagram:
Ishikawa fishbone diagram
Step 1: Identify and define the effect/problem:
Something that we want to improve or control

Ishikawa fishbone diagram
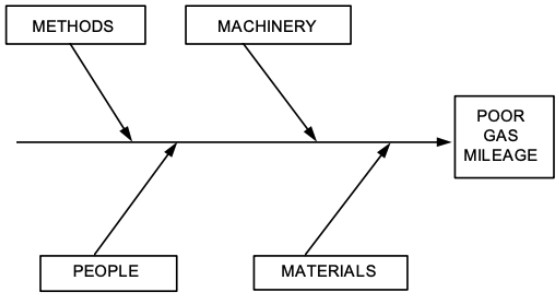
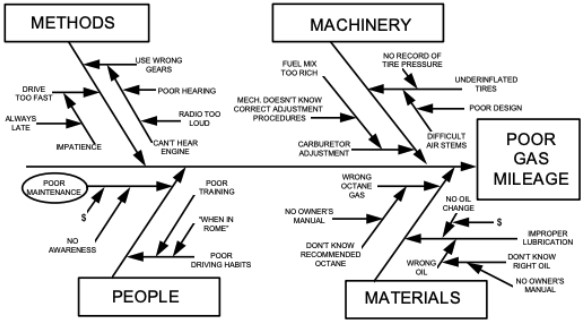
Step 2: Identify main categories:
Other potential headings for causes:
Culture
Measurement
External Environment
Policies
Procedures
Machine / Technology
Ishikawa fishbone diagram
Step 3: Identify causes influencing the effect:
Categorising causes can be a challenging task. You may need to create more main causes or redefine the main causes.
Ishikawa fishbone diagram
Step 4: Add detail levels
Write in more detailed factors unpacking the possible causes and influencing factors further
Ishikawa fishbone diagram
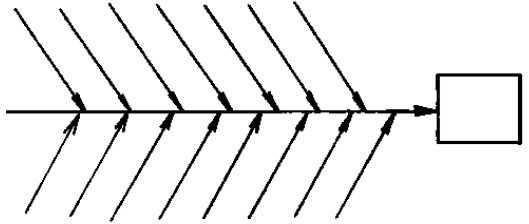
Bad cause-and-effect diagrams
If your diagram looks like this, then your knowledge of the process is still too shallow.
Exercise:
In your groups, select one of the problems you identified from the Faulkner Fabrications case study and create a cause-and-effect diagram.
A word about
automating
processes.
Instead*:
1.Understand (ignore IT)
2. Improve (without using IT)
3. Ask, can IT further improve this process or system?
4. Measure the improvement
Leverage points in a system
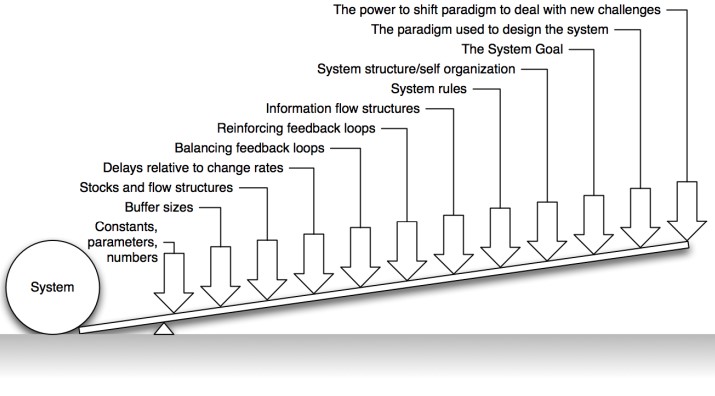
Systems thinking
Action research has consistently show the dominant effect of system characteristics on variation in individual performance (e.g. Deming, Ohno, Womack & Jones, Seddon)
Individual performance within a system is significant but we should keep it in perspective
HRM lesson of this work is to support workers to understand and improve the system (e.g. High-discretion management styles and the concern with innovation)
Systems
Everybody works within a system, governed by conditions over which the individual has no control... In the American style of management, when something goes wrong the response is to look around for someone to blame or punish... The 85 15 Rule holds that 85 percent of what goes wrong is with the system and only 15 percent with the
individual person or thing
Culture
Cultureis a popular concept in management thought and practice
Its one of a number of concepts used to understand that effect of group processes on behaviour:
Out-grouping, role sending, social-loafing, groupthink, behavioural (production) norms, ...
People mean different things by culture one influential definition is
Culture
A pattern of shared basic assumptions that the group learned as it solved its problems of external adaptation and internal integration, that has worked well enough to be considered valid and, therefore, to be taught to new members as the correct way you perceive, think, and feel in relation to those problems.
Performance measurement: behaviourism
The study of the effects of rewards on behaviour
(Performanceis a combination of behaviour, consequences and judgement about both)
Physiological & mainstream psychological research in the 1st half of the 20th century
Showed that behaviour can be conditioned by associating it with reinforcers
In behaviourism, changes in behaviour are synonymous with learning .

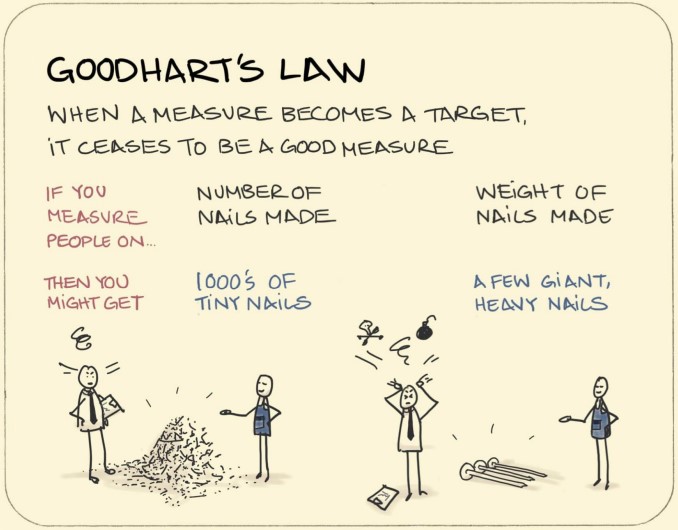
Weighing the pig wont make it any fatter
Barlish & Sullivan (2012) Case Study:
ROI of reduced change orders 70%
ROI of improved scheduling 53%
Giel et al (2010) Case Study:
ROI of reduced change orders 16.2% - 1653.9%
Lee et al (2012) Case Study:
ROI of design error identification 172% - 937%

Feedback loops
Are you struggling to keep up with the demands of your academic journey? Don't worry, we've got your back!
Exam Question Bank is your trusted partner in achieving academic excellence for all kind of technical and non-technical subjects. Our comprehensive range of academic services is designed to cater to students at every level. Whether you're a high school student, a college undergraduate, or pursuing advanced studies, we have the expertise and resources to support you.
To connect with expert and ask your query click here Exam Question Bank
