LATENT VARIABLE SEM AND MLM DATA ANALYSIS
- Country :
Australia
LATENT VARIABLE SEM AND MLM DATA ANALYSIS
Question 1:
Describe one benefit and one limitation of using latent variable structural equation modelling to explore the association between students socio-economic status, physical health, academic achievement, and stress.
Question 2:
Check the distribution of the items used to measure students SES and compare these with the distribution of the items measuring students physical health. Briefly describe your findings and the important implications they have for estimating a latent variable SEM with these variables.
Question 3:
Each of the observed variables in the dataset can be thought of as an indicator of a latent construct. Before you can look at associations between the latent constructs, you need to estimate a measurement model that codifies the relationships between the observed variables and the latent constructs.
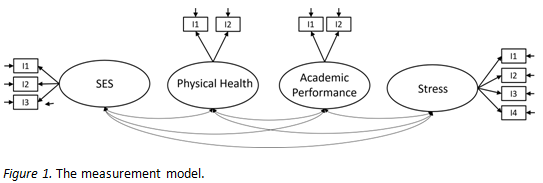
Question 3a:
Estimate the model depicted in Figure 1 and check Mardias test. What action do you need to take based on the result of this test? Briefly report on what you will do.
Question 3b:
Once you have accounted for the results of Mardias test, report the measurement model fit according to APA guidelines. How well did the model fit the data? Are there any issues with the model? Report on your observations and the steps you will take to revise the model if necessary.
Question 3c:
Estimate a revised measurement model and report model fit according to APA guidelines. How well did the model fit the data?
Question 4:
Based on the relevant research literature the following hypotheses can be made.
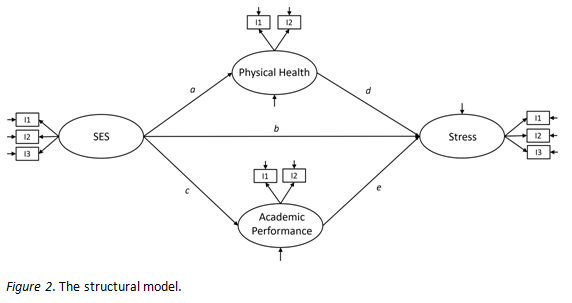
Students with higher socio-economic status have more access to resources. Therefore, SES will be positively related to physical health (H1; path a) negatively related to stress (H2; path b) and positively related to academic performance (H3; path c).
Physical health is a known buffer of stress. Students with higher level of physical health, therefore, will experience lower levels of stress, that is, they will be negatively associated (H4; path d). Finally, students who are achieving academically are likely experiencing less stress than those who are falling behind in their studies. Therefore, a negative direct association is anticipated between academic performance and stress (H5; path e).
Formally, the model depicted in Figure 2 is hypothesised to explain important factors that contribute to adolescents stress during Year 12.
Question 4a:
Estimate the model depicted in Figure 2 and report model fit according to APA guidelines. How well did the model fit the data?
Question 4b:
Report in-text on all paths estimated and interpret them according to the hypotheses. Explain what the supported and unsupported hypotheses may mean for Year 12 students.
Question 5:
Outline the primary reason why it is important to use multilevel modelling when seeking to answer hypotheses about students stress across schools. Discuss the important implications.
Question 6:
Multilevel modelling can be used to answer the following three research questions:
RQ1: Does socioeconomic status have a negative association with Year 12 stress?
RQ2: Does a students school affect levels of stress?
RQ3: Does the association between socioeconomic status and stress vary between schools?
Question 6a:
In an APA 7th formatted table report the relevant statistical values for the following:
i. a random intercepts fixed slopes model including socioeconomic status and stress.
ii. a random intercepts random slopes model including socioeconomic status, stress, and school.
iii. a comparison of the fit indices of the first and second models.
Question 6b:
Provide a brief description of the first model. Interpret the statistical values of this model and use them to answer research questions 1 and 2.
Question 6c:
Provide a brief description of the second model. Interpret the statistical values of the second model (in comparison to the first) and use them to answer research question 3.
Question 7:
Graph the random intercepts random slopes model. Provide an interpretation of the graph. What additional insight can be gained about the model from graphing it? What is one practical insight or recommendation you can make based on your findings? Include a copy of the image you have produced as a part of your response.
