Machine Learning Applications in Bankruptcy Prediction DAT4059
- Subject Code :
DAT4059
Introduction
Bankruptcy prediction in todays modern world has become a critical area of study in financial sectors. This increases complexity as well as volatility of the economic environment worldwide. Predicting a companys bankruptcy plays a crucial role for different stakeholders as per their various business logics. Machine learning in the sector of data analytics and computation processes has become a powerful tool in comparison to traditional techniques.
The main focus of the study is to apply machine learning algorithms to predict bankruptcy possibilities and compare their effectiveness with conventional statistical models. Various machine learning models such as Random Forest model, and k-nearest model will be explored in this research as well as their strengths and weaknesses also measured.
Methodology
The methodology includes the following steps data preprocessing, feature selection and data split, Random Forest model, and K-nearest neighbor model. Every phase describes the process of model development, model training, and model assessment aims to perform bankruptcy prediction (Brenes et al. 2022).
Data Preprocessing:
The data preprocess includes an importation of a data set, with an overview of elements of the data set. The data integrity is maintained by finding and dealing with missing data (Zhao et al. 2020). The Exploratory Data Analysis (EDA) in the form of correlation matrices and distribution plots have been used for visualizing the patterns and detecting outliers specifically in the context of financial values connected to bankruptcy (Peng et al. 2021).
Data Visualization:
Data visualization techniques are used as fundamental approaches in analyzing the characteristics of the dataset in the context of bankruptcy prediction. Visualizations such as histograms, scatter plots, and box plots highlight significant features and distribution of various financial ratios and patterns (Makowski et al. 2021). Correlation heatmaps point out the correlation between the variables; highlighting features with maximal correlation to the based metrics.
Feature Selection and Data Splitting:
The dataset contains the single target variable Bankrupt analyzed, and features selected depending on their relevance to bankruptcy risk. The data retrieved is divided into training and testing sets to maintain the honesty and accuracy of the model (Zhang, 2021). Another advantage of the adopted train-test split that the ratio of the target classes is preserved in both sets and there is control over class imbalance.
Model Training with Random Forest:
The Random Forest Classifier has been chosen based on the assumption of the model that has built multiple decision trees in a forest to reduce over-fitting risk while improving predictive accuracy (Zhang and Li, 2021). Acuracy score obtained from the Random Forest model which visualizes the ability to work out intricate structures within the data and distinguish between bankruptcy and non-bankruptcy (Sekuli? et al. 2020).
Model Training with K-Nearest Neighbors (KNN):
The K-Nearest Neighbors, algorithm has been performed on the dataset to identify bankruptcy and non-bankruptcy. As an instance of the non-parametric classification, the use of KNN depends on the closeness of data points to each other in the feature space (Sheykhmousa et al. 2020). The findings with KNN obtained a 96.18?curacy, the F1-score determining the minority class, namely bankrupt, is low, suggesting that there are difficulties in accurately predicting cases of bankruptcy.
Results, insights, discussion, and recommendation
Result
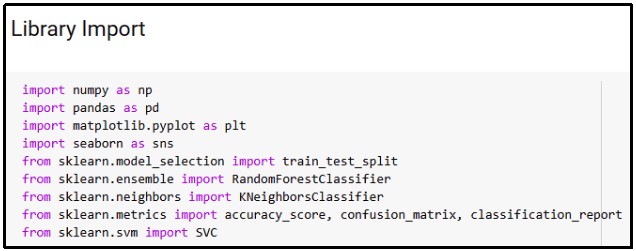
Figure 1: Library Import
(Source: Google Colab)
Libraries that are required to perform the analysis are imported into the Google Colab platform. Different libraries such as numpy, pandas, matplotlib, train test split, Random Forest classifier, and Kneighbors classifier are imported. Pandas are imported to load and read the dataset, and numpy is imported to read multidimensional arrays.
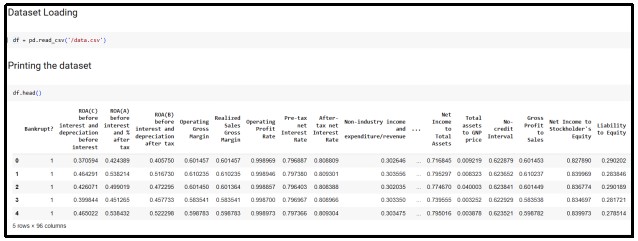
Figure 2: Load and read the dataset
(Source: Google Colab)
The dataset is loaded by using a third-party library of Python programming language and the output is shown in this figure. First five records of the dataset are visualized by using the head function on the Python code.
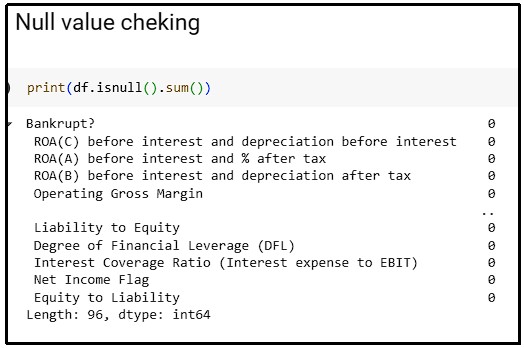
Figure 3: Null value checking
(Source: Google Colab)
Null values are checked on the dataset by using the Python programming language in the Google Colab platform. The functions such as isnull and sum are used to check the presence of null values in the dataset. No such null values are noted in the respective dataset after performing the null value checking.
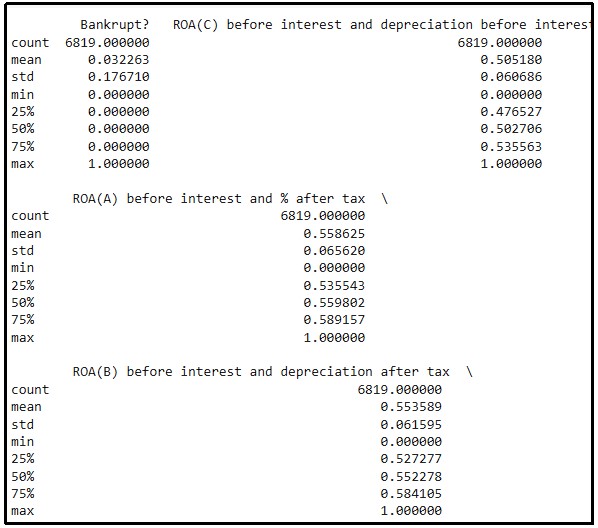
Figure 4: Descriptive statistics
(Source: Google Colab)
Descriptive statistics of different attributes of the dataset are calculated by using Python programming language. Total of 6819 counts of records of different records are calculated with ninety-six attributes. Mean, median, mode, standard deviation, and so on of different aspects are calculated in the descriptive statistics.
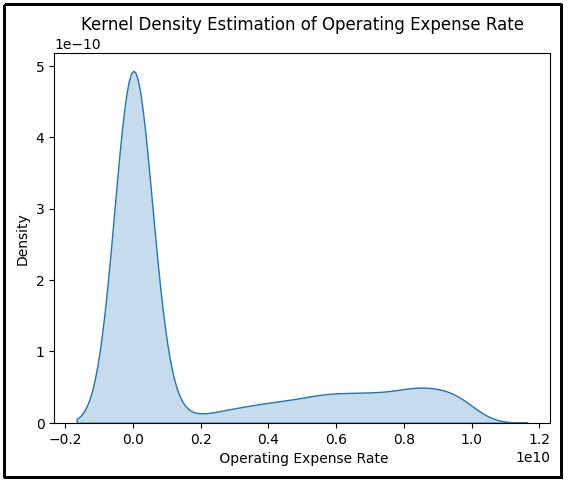
Figure 5: Kernel density estimation of operating expense rate
(Source: Google Colab)
The above figure illustrates a Kernel Density Estimation (KDE) of the operating expense rate. The horizontal axis of the operating expense rate has been used on the vertical axis and density has been used. The high concentration of the data points surrounding the vertical axis at zero has been described by sharp peak.
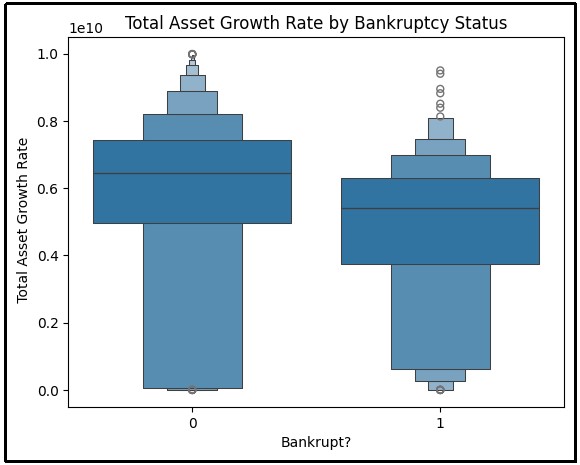
Figure 6: Total asset growth rate with bankruptcy status
(Source: Google Colab)
The above figure is a boxplot that compares total asset growth rates grouped for bankruptcy status with 0 standing for non-bankrupt and 1 for bankrupt. The plot emphasizes total asset growth rate distribution where the non-bankrupt groups range is wider and the median is higher than the bankrupt.
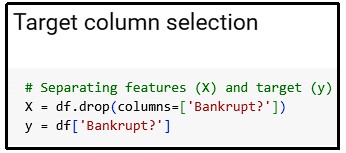
Figure 7: Target column selection
(Source: Google Colab)
The above figure illustrates the target column for model prediction. Bankrupt ? is used as the target column and the value of bankrupt is predicted through the model training.
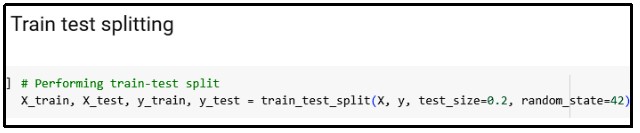
Figure 8: Train test splitting
(Source: Google Colab)
The train test splitting part is depicted in the above figure which is implemented in the Python programming language. The train_test_split module in Python is used to split the dataset. Total 80% of data is used for model training and 20% of data is used for testing the model.
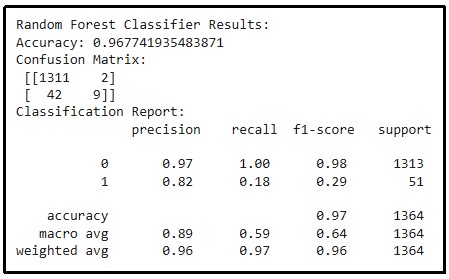
Figure 9: Result of Random Forest classifier
(Source: Google Colab)
The above figure visualizes the findings after executing a Random Forest Classifier. The accuracy is 0.9677 and the confusion matrix shows 1311 true positives and 2 false positives of class 0 while 9 true positives and 42 false negatives of class 1. The model has an accuracy of 0.97%, a recall of 0.59% using macro average, and an F1 score of 0.64%.
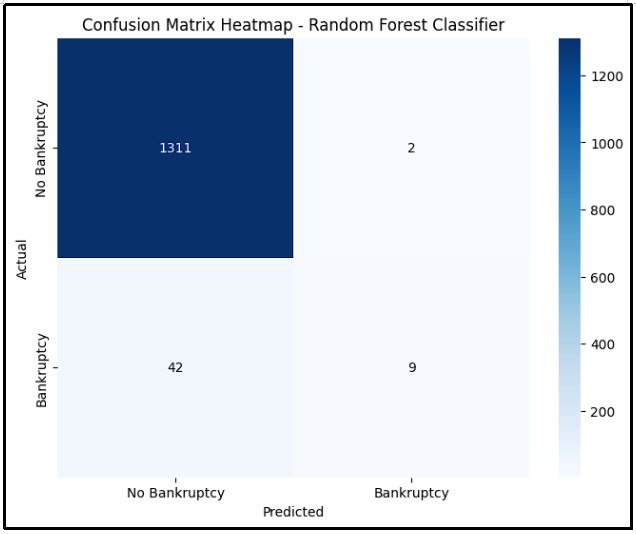
Figure 10: Confusion matrix of Random Forest classifier
(Source: Google Colab)
The image illustrates the confusion matrix heatmap of the Random Forest Classifier in the bankruptcy prediction. The matrix demonstrates the effectiveness of the model prediction between the bankrupt and the non-bankrupt. The instances of bankrupt class capture the model achieved 9 true positives plus misclassified 42 instances as non-bankrupt, a problem in minority class instance conception.
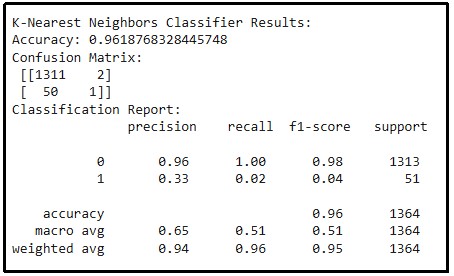
Figure 11: Result of K-Nearest neighbors classifier
(Source: Google Colab)
The above figure illustrates the performance of a KNN classifier, according to which the accuracy of the model is 0.9619. The confusion matrix reveals 1311 values for true positive + 2 for false positive in class 0, while in class 1, it provides only 1 value for true positive + 50 for false negatives. The accuracy obtained is 0.96, but there is an imbalance in the performance, the macro average is 0.65 and the weighted average is 0.94 because class 0 dominates the dataset.
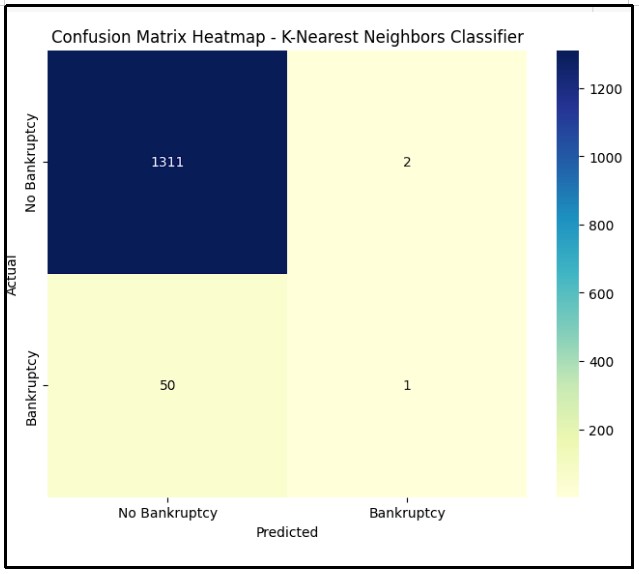
Figure 12: Confusion matrix of K-Nearest neighbors classifier
(Source: Google Colab)
The above figure illustrates a confusion matrix heatmap for the KNN Classifier applied to the bankruptcy prediction. Exploratory and validation sets have been built for the K-nearest neighbors model. The model consistently performed poorly confirming only one minority bankrupt class while misclassifying 50 for non-bankrupts. The matrix visualizes a distortion in the classes particularly a high level of miss-classification of positive bankrupt cases.
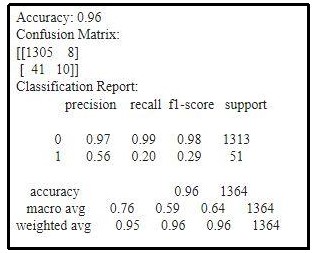
Figure 13: Result of Logistic Regression
(Source: Google Colab)
Logistic Regression model is performed with a accuracy score of 0.96, which is quite well as per the dataset. F-1 value and recall value is also very well that is read as 0.98 and 0.99 respectively.
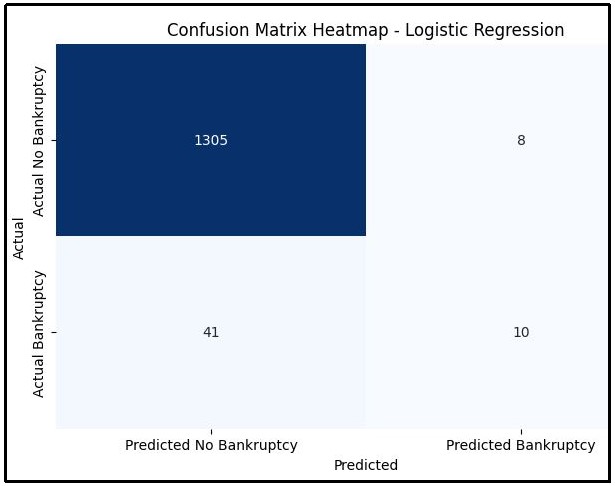
Figure 14: Confusion matrix of Logistic Regression
(Source: Google Colab)
Confusion matrix of Logistic Regression is generated in which actual bankruptcy and predicted bankruptcy are calculated. This results a good accuracy with efficient predicted data.
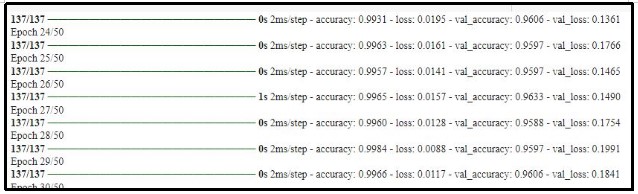
Figure 15: Result of ANN model
(Source: Google Colab)
ANN model is performed and its result is shown in the figure. This model gives a accuracy score of 0.99 which is excellent with a approximate loss of 0.0161 to 0.0141.
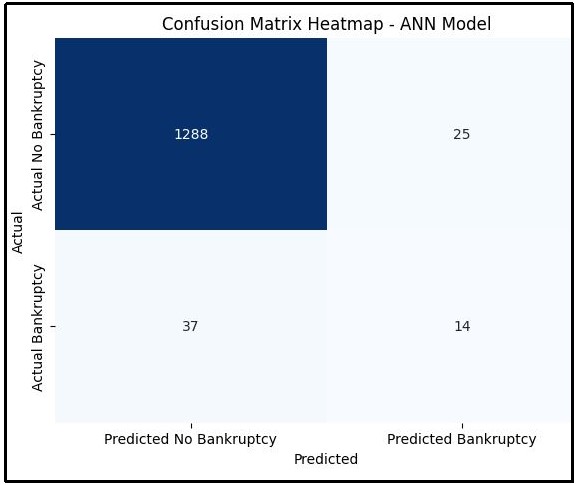
Figure 16: Confusion matrix of ANN model
(Source: Google Colab)
Confusion matrix of ANN model is generated using Python programming language. Predicted bankruptcy and non-predicted bankruptcy with actual bankruptcy and actual no bankruptcy is perform. 1288 cases are found with Actual no bankruptcy which is quite well output as per the model.
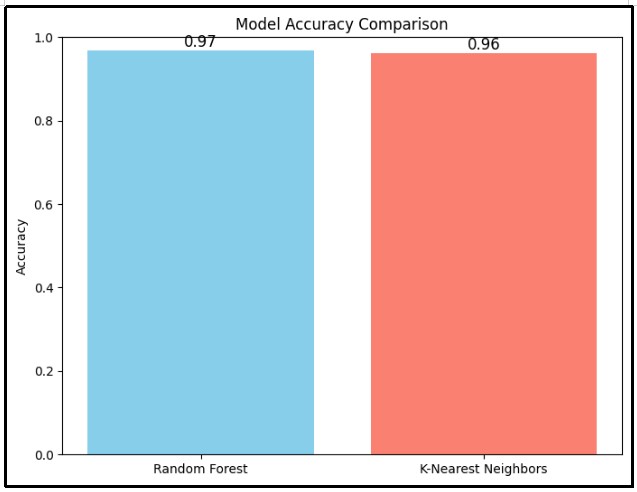
Figure 17: Comparison of model accuracy score
(Source: Google Colab)
The above bar chart compares the accuracy of two models using the machine learning technique; Random Forest and K-Nearest Neighbors (KNN). The analysis visualizes that the accuracy of the Random Forest is slightly higher than the KNN model.
Insights
The result from Random Forest classifier and k-nearest neighbors or KNN classifiers reveal valuable insights in this study. Accuracy score of Random Forest classifier is calculated as 96.77 percent and k-nearest neighbors classifiers as 96.19 percent which are quite favorable for the study (Adriana and Francis, 2020). The findings as per question number one are that both of these models have the capacity to accurately predict bankruptcy (Brotman, 2022). The Random Forest model is slightly better than the KNN model. Precision for classifying bankrupt companies as per Random Forest classifier is read as 0.97 which says a high level of accuracy in predicting companies that are at risk of bankruptcy. The overall analysis states the Random Forest model is better than the KNN model for analyzing bankruptcy in the industrial standard (Alam et al. 2021).
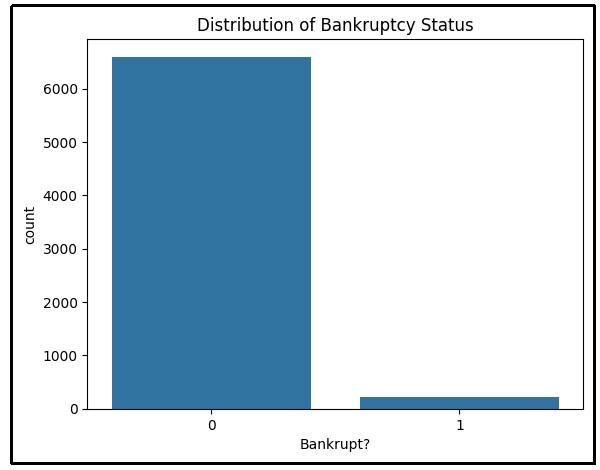
Figure 18: Distribution of Bankruptcy status
(Source: Google Colab)
Bar chat of distribution of bankruptcy status is visualized, derived by using Python programming language. Zero in this figure presents a negative response and one presents a positive response. There are more than 6500 cases where no bankruptcy observed and less than 1000 cases where bankruptcy occurs which is very low.
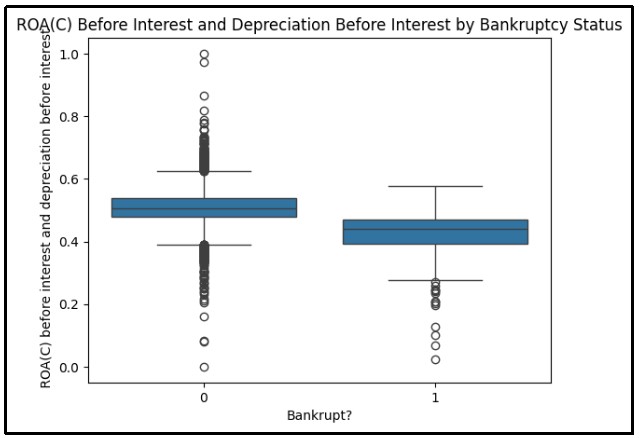
Figure 19: Description before interest by bankruptcy status
(Source: Google Colab)
The boxplot visualizes the description of bankruptcy status before interest and description before interest by using Python programming language. Before interest and description before interest bankruptcy is found in the region of 0.3 to 0.5 or in the middle of 0.4.
Discussion
As per question number two several key predictor variables are chosen in this analysis such as Profitability ratio for example ROE before interest and tax, operating gross margin, and net profit per share which measures the ability of the company to generate profit by sales, assets and equity (Adinyira et al. 2021). Some control variables such as tax rate, market-based variables are chosen in this analysis.
Recommendation
The analysis recommends the Random Forest model may be more suitable because of its little higher accuracy score and precision result. Another point of view, the KNN model may be also a better choice as its recall value is higher (Antulov-Fantulin et al. 2021). This provides a non-linear explanation of the relationship between financial variables and bankruptcy to reveal more complex problems. Thus, by implementing these methods analysis can extend the existing research.
Limitations and Conclusion
Limitations
A few disadvantages interfere with the prediction of bankruptcy Random Forest and K-Nearest Neighbors (KNN) models present an accurate predictive model for bankruptcy but it has certain drawbacks. As per question three, first, the distribution of the dataset is skewed in that there are far many companies that are not bankrupt. The results in lower recognition of the minority class (bankrupt) and the performance of the model are lessened, for KNN which commonly misclassifies the bankrupt companies. The Random Forest has greater accuracies, but its relatively high-time consumable algorithm so it is impractical to use for real-time forecasting of big data.
Conclusion
Bankruptcy prediction remains necessary to act as an indicator that helps stakeholders avoid certain financial risks. The Random Forest and K-Nearest Neighbors (KNN) analysis have been used to forecast company failures in this research. Random Forest dealt with data complexity in a better way as compared to KNN. The improvement approach is better and quite applicable to the real world more advanced integration of Machine learning algorithms with greater depth of financial analysis boosts the framework for more improved bankruptcy prediction.
Are you struggling to keep up with the demands of your academic journey? Don't worry, we've got your back!
Exam Question Bank is your trusted partner in achieving academic excellence for all kind of technical and non-technical subjects. Our comprehensive range of academic services is designed to cater to students at every level. Whether you're a high school student, a college undergraduate, or pursuing advanced studies, we have the expertise and resources to support you.
To connect with expert and ask your query click here Exam Question Bank
