Corporate Financial Analysis and Valuation ACC6015
- Subject Code :
ACC6015
Company Overview
Company's History
KPJ Healthcare Berhad was founded in 1981 and is part of the Johor Corporation Group. The company has grown immensely over time. It started by providing healthcare services in Malaysia. The company has expanded from a single IMG building hospital to over twenty-five enclosed hospital facilities throughout Malaysia and several other countries. Some of these are acquiring different hospitals and centres and integrating KPJ University College to enhance medical learning (KPJ Healthcare Berhad, 2023). KPJ Healthcare has expanded itself to be one of the prominent players in the private healthcare providers in Malaysia.
Principal Activities
KPJ Healthcare Company mainly provides health care services with various specialties in outpatient, inpatient, diagnostic, surgical and some other services. It delivers various specialties and medical specialties, including cardiology, cancer, Bones, and nerves. The company's additional divisions are KPJ Specialist Medical Centre and KPJ Damansara Specialist Medical Centre, which expand the range of services provided in healthcare (KPJ Healthcare Berhad, 2023).. Another area of operation for KPJ Healthcare is education in the field of healthcare through its University College, which enforces the group's overall mission to improve the health sector through the enhancement of medical knowledge.
Main Customers and Competitors
KPJ Healthcare's primary stakeholders are the consumers who require private health care services in the country of Malaysia. The insured and the non-insured patients are among its clientele base, which cements customer variability. The competition the company has is on the other players in the private healthcare sector, IHH Healthcare Berhad which manages Pantai and Gleneagles Hospital as well as Columbia Asia Hospitals. KPJ Healthcare's competitive advantage strategy comprises the availability of a more comprehensive network of facilities and an emphasis on quality and affordable healthcare services (Azmi, 2023). The expansion in the need for health services in Malaysia, together with the other countries in the Southeast Asian nations, remains a compelling prospect for KPJ Healthcare.
Information on top management and directors remuneration
Encik Ahmad Shahizam, who has more than a decade of experience in the healthcare management industry, heads the board of directors of KPJ Healthcare Berhad. The executive team utilizes the services of healthcare and finance professionals to form its strategic direction (Financial Times, 2024). This remuneration package ensures that the best talents are retained and attracted in line with shareholders' interests.
Analysis of the latest 3 years performance
Commentary on Horizontal Analysis
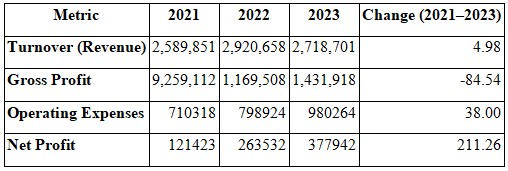
Below is a horizontal analysis of KPJ Healthcare's Statement of Comprehensive Income for the year 2021, forecast for the year 2022, and budget for the year 2023 as per the values provided by you. The flow between turnover, gross profit, operating expenses, and net profit is compared to understand the trend over the three years.
Turnover (Revenue):
KPJ Healthcare's growth from 2021 to 2023 was achieved by a (4. 98 %) revenue. This means the company has achieved steady annual sales growth in light of the harsh economic environment, which may be attributed to rising healthcare needs.
From 2021 to 2022, it rose to RM (2. 92) billion and then slightly declined to RM (2. 71) billion in 2023. The above target shows that though it declined in 2023, it could be due to a change in market price or operation strategies; the overall revenue performance has been improving over the period.
Gross Profit:
A sharp decline in gross profit is observed, with the figure reduced to (84. 54%) for 2021 and 2023. The company's gross profit was RM (9. 26) billion in 2021, reduced to RM (1. 17) billion in 2022, and again slightly rose to RM (1. 43) billion in 2023.
The significant drop could be due to an increase in the COGS, additional expenses brought about by the pandemic, or decreased profitability of the company's core activities. A steep decline should alert the overall cost management or margins of the business.
Operating Expenses:
Operating expenses increased more than proportionately from 2021 to 2023 by (38. 00%). Operating expenses in 2021 were (RM 710. 3) million, which was higher than in 2022, which was (RM 798. 9) million and further to 2023s estimate, which is (RM 980. 3) million.
This emerging trend might suggest that KPJ Healthcare increases operational capacity or incurs certain increased costs related to inflation or labour. However, operating expenses have also increased, and this has happened with no growth in gross profit, which is a major worry when it comes to operational efficiency.
Net Profit:
However, operating expenses continue to rise while gross profit decreases; overall, net profit experienced a growth of (211. 26%) from 2021, when it was recorded at RM 121. 4 million, to 377. 9 million in 2023.
That is why the increase in net profit is sharp, and it can be explained by the appearance of non-operating income, better financing conditions, or more effective taxation. For the same period, the gross profit margin was not very favourable, but overall, the company's bottom line was much better, which might be due to strict cost control measures or one-time gains.
Key Insights:
Revenue Growth: KPJ Healthcare's revenue has increased slightly less than 5% in the last three years, which proves its stable position in the market.
Profitability Issues: This tremendous decline in the figure raises questions regarding cost control or a decrease in gross margin. While net profits increased, it is important for the company to manage the following issues that reduce gross profit.
Cost Control: Increased operating expenses would mean a lack of efficiency, especially considering that gross profits have also dropped at the same time. Management must find ways to improve the control of these costs in order to improve profitability.
Improved Net Profits: The staggering increase in net profit is an encouraging feature, which could indicate that while operations may not have been up to standard, the organizational financial state has been fine-tuned to the maximum.
Commentary on Vertical Analysis
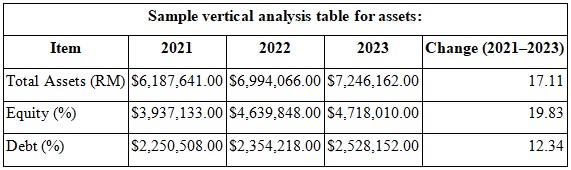
Vertical Analysis of KPJ Healthcare's Statement of Financial Position for the Years Ended 31 December 2021, 2022 & 2023.
In a vertical analysis, each item of the statement of financial position is stated as a percentage of total assets, making it easy to analyse the structure of a company's finances over time. In this case, we will compare KPJ Healthcare's total assets, equity, and debt for 2021 with the projected forecast for 2022 and 2023.
Total Assets:
The total Gross Assets of KPJ Healthcare group have been rising progressively over the three years, with actual figures escalating by (17. 11%) from RM (6. 19) billion in 2021 to RM (7. 25) billion in 2023. This increase shows that the company is creating more assets; this may be attributed to additions in the units, equipment, efficiency or other facilities.
The increasing total assets figure indicates KPJ Healthcare's solid financial position, which indicates that the organization can expand its business operations.
Equity:
Shareholders' equity, a measure of stock ownership, has grown by 19%. 83% from RM 3. 6 billion in 2009 and will increase to RM 4. 72 billion in 2023.
This ratio also shows the total assets funded by equity, and the trend indicates that it rose from funding to 63%. The average annual growth rate rose from 63% in 2021 to 65. 10% in 2023. This implies that shareholders' equity funds several fixed assets, implying that the company depends little on debts. This picture is evident as the ratio of equity Salvage to its total amount of funds is higher, meaning that the company has a lower debt level, and thus, lower interest expense impacts its financial health.
This may be provided by retained earnings or capital arising from shareholders, showing the revenue-generating prospects and profits that KPJ Healthcare has been able to provide to its shareholders.
Debt:
Debt accounts have also expanded but not in proportion with the total assets, only at a rate slower by 12. 34%, from RM 2. Twenty-five billion in 2021 to RM 2. 53 billion in 2023. Nevertheless, what is essential the role of debt financing in total assets has slightly declined from 36%. In 2021, it was 37% to 34." 90% in 2023.
Less dependence on assets by debt is considered favourable since it decreases the company's financial risk and interest cost. The reduction in the percentage of debt also illustrates better equity and debt financing ratios, which lead to better financial control for KPJ Healthcare and decreased sensitivity to interest rate fluctuations or poor liquidity position.
Key Insights:
Due to its sound financial structure, particularly in the financier, KPJ Healthcare has a lower debt dependency than equity. This means that the company should exercise great caution when using leverage, as this will enable it to avoid accumulating more debt than it can afford.
This means that the company's balance sheet is very stable, hence lowering the risk of investing in KPJ Healthcare. It also means that the extent of the company's exposure to financial risk, or what is known as financial leverage, has reduced, or better still, the debt percentage has reduced, and this is important during lean years.
In the future, the efficiency of the company's operations to make a profit and invest in equity to expand will also be relevant to the formation of its favourable financial condition. KPJ Healthcare's very low-risk financial framework has been highlighted by vertical analysis, which clearly indicates that over 65% of its assets were financed through equity during the last fiscal year (Hare, 2018). This demonstrates financial prudence and good shareholder support.
Group financial analysis of the latest 3 years
The evaluation of the financial ratios provides a significant value by providing essential and functional clues about the company's financial status and performance in the past periods. With the help of such coefficients as the profitability, liquidity, solvency, and efficiency of the firm's assets, stakeholders can determine its efficiency and financial situation. The following sections rationally evaluate the ratios of basic and advanced levels from 2021 to 2023 to determine the trends and risks.
The financial benchmarks are not just numbers but invaluable tools that offer a comprehensive view of the company's performance over a specific period. These benchmarks, which include profitability, liquidity, solvency, and asset efficiency, provide a clear picture of the firm's viability and efficiency. The following sections meticulously examine the trends of the selected key financial ratios for the period between 2021 and 2023, empowering you to identify potential issues and make informed decisions.
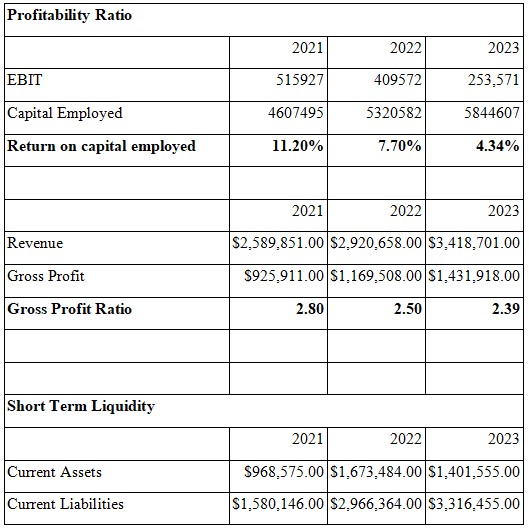
The ROCE has reduced by a more significant trend as compared to 2021. The share of electronics exports have increased from 20% in 2021 to 4. Up by 34% in 2023; this is a decline in the company's Capital utilizing effectiveness in returns in its capital base. Several factors could contribute to this decline:
- Rising Capital Employed: From the tables, it is evident that the Capital employed has risen for each year without a proportionate addition in earnings. This may mean that the firm is investing in assets or expanding without attaining efficient returns on these investments.
- Decreasing EBIT: A decline in EBIT might thus suggest poor production and operation, rising costs, or low sales generation.
This is worrying, especially given that the firm's ROCE is lower. It means that the firm is not utilizing the capital as it is expected in the right manner that is prevalent in the market. This forces the company to reduce its rate of investment, and therefore, if this trend persists for some time, investors will be discouraged by the rate of return on investments. This must be addressed immediately to avoid eroding investors' confidence in this board.
Gross Profit Ratio
The gross profit ratio, which shows the proportion of gross profit to total sales, is calculated by the difference between total sales and cost of goods sold (COGS) and is a vital tool to assess a firm's ability to control costs and generate revenues in production. Nevertheless, an adverse change in the gross profit ratio may be an indication of some hazards like poor cost management or low operational efficiency in a business organization. They are all possible, and to protect the company's financial situation, one should be cautious of such tendencies.
Still, this trend is counterbalanced by the fact that the overall decrease in profitability, as measured by ROCE, means that gross profit increments might be eaten up by operating expense increases or other non-gross profit areas. Therefore, the company may improve its efficiency in producing its goods and services. At the same time, it could be slipping in its ability to handle other overhead costs and, therefore, experiencing a net decline in its profitability.
Liquidity Ratios
Liquidity ratios show the company's prospects to pay for its near-future obligations. Lower levels of liquidity indicate possible issues regarding cash flows, as the firms' performances can track their capacity to pay off debts or finance business operations. Here, we use the Current Ratio for decision-making with a view to determining short-term solvency.
Current Ratio
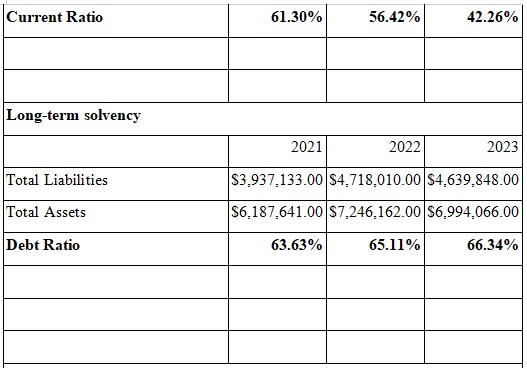
The current ratio gives information about a particular company's capacity to pay off short-term debts with short-term resources. A head-and-shoulder top formation occurs when the ratio is below 1, which means that the firm may find it difficult to pay the amounts in the short run.
This current ratio has declined gradually from 0. First, it increased from 61 to 0 in 2021. 42 in 2023, which implies a dangerous tendency for an increase in the liquidity risk. This means that the company has less than 50 per cent of the current assets necessary for meeting the current liabilities. Industry standards as used in ratio analysis for working capital management are as follows: Current ratio which is a measure of the firm's ability to pay the current liabilities out of current assets; a current ratio below 1 indicates that the firm may find it extremely difficult to meet its short term obligation without necessitating additional funds from a balance sheet source or through sale of assets.
This declining trend can pose significant risks for the business:
- Operational Strain: The decline in the current ratio, which fails to cover current liabilities, may lead to operational pressures. In such a situation, the firm may have to seek financing to meet some of its immediate obligations, potentially straining its operations.
- Supplier Confidence: The second risk is that the deteriorating liquidity position may weaken supplier confidence, further complicating relations with main suppliers and resulting in higher cost of goods.
Alternatively, strengthening liquidity position should be another crucial concern for management. Some examples may include increasing credit facilities to cover short-term needs by recasting shorter-term debts as longer-term debts or seeking to improve ways of increasing cash inflow through better management of receivables and inventory.
Solvency Ratios
Solvency ratios provide insights into a firm's capability to meet long-term legal obligations and into its general financial strength. The Debt Ratio is a very significant financial risk measurement in this respect.
Debt Ratio
Debt is also calculated as the total amount of debt divided by total assets, which shows the amount of a business's assets that are funded by debt. This means the higher the ratio, the higher the financial leverage and, therefore, more financial risk, particularly in an unfavourable market environment.
The debt ratio has increased from 63 per cent to 72 per cent for the same period, indicating that more use of the borrowed amount was made in the fixed assets. Meanwhile, the: 65% in the year 2021 to 66.34 23 increase from the previous year, meaning the company's dependence on debts to fund its assets is increasing. This indicates greater financial risk; the company will have to meet more significant interest costs and will have limited ability to mobilize funds from the capital market when investors prefer other securities or during a downturn in the financial market.
An increase in the debt ratio generally becomes a concern to lenders and investors, raising the cost of financial risk and potential default in the event of reduced earnings or future cash flow complications. In addition, increased borrowings may restrict a firm's borrowing capacities, making it difficult for a firm to borrow at a low interest rate.
To reduce financial risk, the company may need to:
- Reduce Debt: Reducing the debt level will mean that the debt ratio is also reduced, meaning a lower risk is involved.
- Improve Asset Utilization: Increasing asset intensity might enable the company to earn more returns, leaving little or no need to invite debt.
Asset Efficiency Ratios
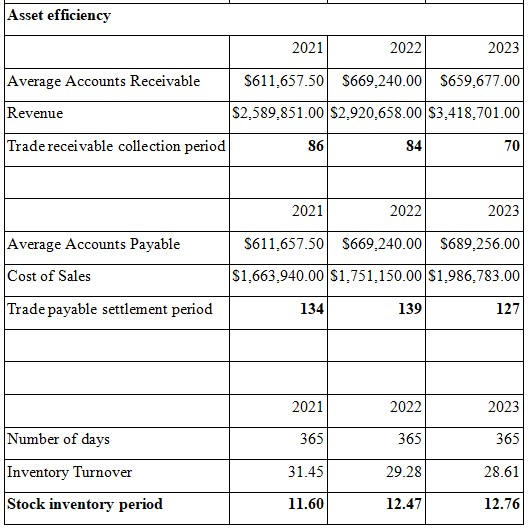
Asset utilization ratios evaluate a company's capability to effectively utilize its assets to generate revenues. This concentrates on the Trade Receivable Collection Period, Trade Payable Settlement Period, and Stock Inventory Period.
The trade receivable collection period has shown a significant positive change, reducing from 86 days in 2021 to 70 days in 2023. This improvement signifies a healthier cash flow and reduces the risk of non-collectable accounts. However, it's important to note that extending the collection times may not fully address the company's other liquidity issues.
The payable settlement period has shown a steady improvement, reducing from 139 days in 2022 to 127 days in 2023. This reduction implies better supplier relations, but it also puts pressure on liquidity, especially considering the decreasing current ratio. The report should investigate whether the company can sustain these faster payments given its liquidity concerns.
The stock inventory period has risen slightly from 11 days, as indicated in the following image. For 2021, from sixty days to twelve. More time of, 76 days has been taken by the company in 2023 to sell its stock, which shows there has been less stock turnover. A high or more extended inventory period could mean earlier that there is a problem in inventory management or lower sales. This action increases the size of stocks in trading; thus, working capital is trapped, and there is a high possibility of obsolescence, adding pressure on liquidity.
Valuation of the Companys stock price per share
To determine the price per share of KPJ Healthcare Berhad, The Discounted Cash Flow (DCF) model will be used. This widely respected technique, known for its reliability, involves predicting a stock's future cash flows. It is particularly suitable for institutions like KPJ Healthcare, which enjoy contractual revenues from their hospitals' business in the healthcare industry.
Valuation Methodology
- Forecasting Cash Flows: A comprehensive financial report analysis shows that as of March 2019, the current KPI's twelve-month trailing EBIT is approximately RM 452 million, with a net income of around RM 335 million. This thorough analysis provides a solid foundation for our valuation (Financial Times, 2024)
- Domestic analysts estimate earnings growth at about 8 per cent74 per cent per year. Based on this growth rate, I will forecast possible cash flows for the next five years.
- Calculating Free Cash Flow (FCF): Evaluating FCF begins with net income, which indicates non-cash costs and changes in capital. To simplify our analysis, we will use 10 % as the company's expected FCF margin, which is well within the industry average.
- KPJ's revenue statement for TTM is as follows: RM 3. Thirty-one saw an increase in net operating income by RM 66 billion and an estimated current-year FCF of RM 366 million.
- Discount Rate:The discount rate is adjusted to 10?sed on the company risk profile, cost of capital, and an industry analysis of the healthcare business.
- Terminal Value: The terminal value is determined by the Gordon Growth Model, which estimates growth at 3?ter the five-year projection period.
DCF Calculation
Projected Cash Flows: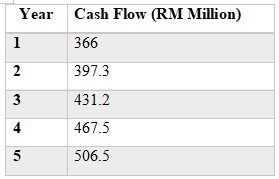 Terminal Value Calculation:
Terminal Value = Final Year Cash Flow (1 + g) / (r - g)
= 506.5 (1 + 0.03) / (0.10 - 0.03)
= RM 7,416.43 million
Present Value of Cash Flows:
Using the discount rate of 10%, we calculate the present value (PV) of the projected cash flows and terminal value:
PV= 366 / (1+0.10)^1 + 397.3 / (1+0.10)^2 + 431.2 / (1+0.10)^3 + 467.5 / (1+0.10)^4 + 506.5 / (1+0.10)^5 + 7416.43 / (1+0.10)^5I
=6,917.85 million
Calculation of Share Price
The estimated price per share can be found by dividing the total present value by the number of outstanding shares. KPJ Healthcare has about 4.5 billion shares outstanding (Investor, 2024).
EstimatedPriceperShare= 4,500 / 6,917.85
= RM1.54
Recommendation
Given the evaluation of the company's past financial data and the performance ratio in recent periods, it is suggested that its shares be held. Here are the key reasons supporting this recommendation:
Financial Performance Insights
- Revenue Growth: KPJ Healthcare has recorded a relatively low percentage increase in its revenues, which stands at about 4%. This is an increase of 98% from 2021 to 2023, while Asia increased by 97% in the same period. This stability in the healthcare market, where the company is already operating, should reassure investors. However, the company's revenue decrease from 2022 to 2023 indicates potential challenges in achieving new growth rates in a changing market.
- Gross Profit Decline: The trend showed that the company's gross profit dramatically reduced by 84 per cent, with a 54?cline from 2021 to 2023. This significant decline raises urgent questions about cost control and the organization's running. The loss of gross profit, coupled with actual profit, suggests that the company might be using other income or one-off gains to improve its results.
- Operating Expenses: Selling, general, and administrative expenses leapt 38% higher over the same period and exceeded revenue growth. This may indicate areas of the production process that could be optimized and hence call for adjustments in a bid to boost profitability.
- Liquidity Concerns: Liquidity ratios, such as the current ratio, have also declined, which could be an issue for the company's liquidity. If the current ratio is below 1, it implies the company's inability to meet its current liabilities without external resources. This concern should be of paramount consideration to investors as it actually depicts the working pressure within the company.
- Debt Management: Although the debt ratio has declined and shows a lesser dependence on debt financing, the overall credit danger is still high. The company needs to continue striving to manage its debt levels better so as to have the best balance sheet.
Valuation Insights
The use of Discounted Cash Flow (DCF) puts the firm's price per share at RM 1. 54, which will help to compare the current stock price in the market. If the market price is much higher than the value shown here, then it can be said that the stock is overpriced. On the other hand, if the market price is lower than the value shown here, then the stock can be said to be under-priced.
Market Position and scopes for further Expansion
KPJ Healthcare faces competition from IHH Healthcare Berhad and Columbia Asia Hospitals, among others. Due to constantly rising demand, the company's projected growth in the Southeast Asian healthcare market remains high. However, to fully capitalize on these opportunities, the company needs to seriously work on process and cost efficiency and liquidity.
While the revenue picture portrays a good condition since it has been growing steadily for that period, the gross profit has been decreasing while operating expenses have been increasing and coupled with liquidity issues, a Hold recommendation is reasonable. KPJ Healthcare should also be scrutinized for more potential investment in cost containment and improvements in its liquidity situation. It would be possible for the share price of this position to appreciate if the company sorts out its operational issues, and at the same time, there would be some protection against downside risks.
Are you struggling to keep up with the demands of your academic journey? Don't worry, we've got your back!
Exam Question Bank is your trusted partner in achieving academic excellence for all kind of technical and non-technical subjects. Our comprehensive range of academic services is designed to cater to students at every level. Whether you're a high school student, a college undergraduate, or pursuing advanced studies, we have the expertise and resources to support you.
To connect with expert and ask your query click here Exam Question Bank
