Statistical Analysis of Consumer Behaviour in E-Commerce STAT2024
- Subject Code :
STAT2024
1. Introduction
This report aims to explore two distinct aspects of customer behaviour on The Iconics online platform, using statistical methods to uncover in-sights. We analyse the sales and user data from January 2004 to September 2004. The goal is to provide actionable insights for business decisions, helping identify patterns.
The report is divided into 4 sections:
- Section 2: Presents the Chi-Squared test for independence to determine if there is a significant relationship between Gender and Product Type preferences.
- Section 3: Covers the t-test analysis to answer the question: Is there a significant difference in 'time spent on the website' by age group (those '30 years old and under', and 'those above 30 years old')?
- Section 4: Conclusion summarises the key findings from both statistical tests and provides recommendations.
2. Chi-Squared Analysis
We conducted a Chi-Squared Test of Independence to determine whether there is a significant relationship between Gender and Product Type. This test evaluates whether different genders exhibit varying preferences for specific products categories (e.g, dresses, jackets etc). For finding out the observed counts, FILTER button was used to filter out the data and get the required counts of each category.
The table below summarizes the observed counts across six product categories for three gender groups: Male, Female, and Other.
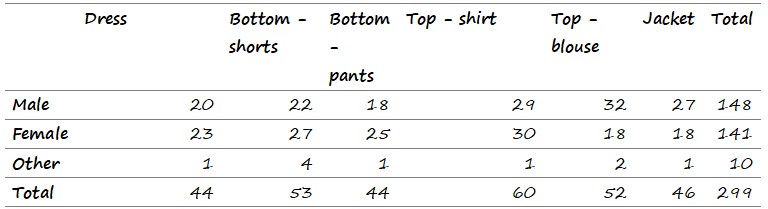
We computed the expected values under the assumption that product preferences are independent of gender. The formula used for the expected counts is :
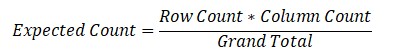
For example, for male customers and dresses, we can find out the expected count as:
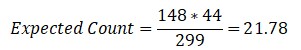
This calculation was repeated for every gender-product combination to fill the expected values table.
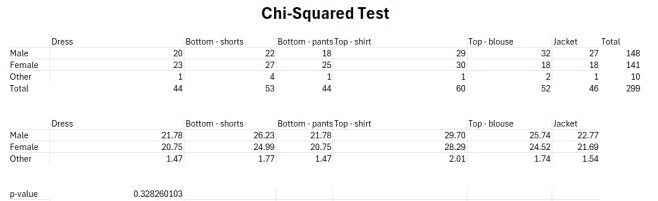
Finally, we used Excels CHISQ.TEST function to calculate the p-value , comparing the observed and expected counts to determine whether there is a statistically significant relationship between gender and product preference.
We obtained a p-value of 0.328. Since the p-value is 0.28, which is greater than the typical significance level of 0.05, we fail to reject the null hypothesis. This means that there is no significant relationship between gender and product type preferences. In other words, product categories seem to be equally popular across all gender groups, and gender does not influence the choice of product in a statistically significant way.
The absence of strong product preferences across genders means the company does not need to heavily tailor product recommendations or marketing campaigns based on genders. Instead, gender-neutral campaigns can effectively engage all customers.
3. Hypothesis Testing II Analysis
The objective of the second part of the analysis is to determine whether there is a significant difference in the time spent on the Iconic website between two age groups: those aged 30 years old and under and those above 30 years old.
To facilitate the analysis, we utilised the FILTER function in Excel to create two separate columns for time spent on the website. We filtered the dataset to isolate records for users aged 30 and under, as well as those above 30.
To check if we can assume equal variances between the two groups, we conducted an F-Test for Two-Sample for Variances using Excels Data Analysis tool.
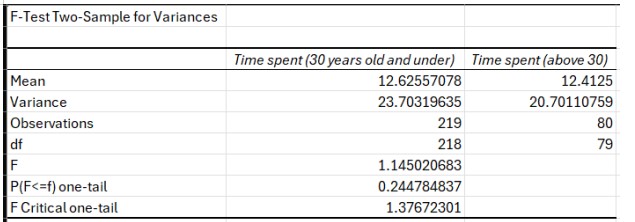
The F-test result indicates that the variances of the two groups those aged 30 years and under and those above 30 are not significantly different. The calculated F-statistic of 1.15 suggest that the ratio of the variances does not show enough disparity to reject the null hypothesis of equal variances. P-value of 0.245 , greater than significance level of 0.05, further supports this conclusion. Thus, we conclude that there is no significant difference in variances between the two groups .
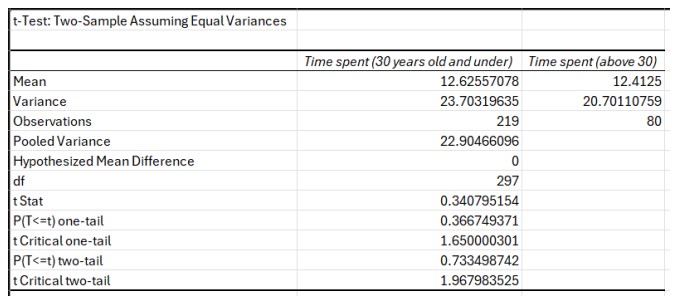
Next, we performed a t-Test for Two-Sample Assuming Equal Variances to test for significant differences in mean time spent on the website between the two age groups.
Null hypothesis is as follows:
There is no significant difference in the mean time spent on the website between the two age groups (those 30 years old and under and those above 30 years old).
Alternative hypothesis:
There is a significant difference in the mean time spent on the website between the two age groups (those 30 years old and under and those above 30 years old).
The t-test results indicated a t-statistic of approx. 0.34, with a p-value of 0.733. This high p-value suggests that we fail to reject the null hypothesis, implying that there is no statistically significant difference in the time spent on the website between the two age groups. This means that both groups spend similar amounts of time on the website.
With absence of a significant difference in time spent on the website by age group, the company can confidently invest in features and content that cater to the entire audience, regardless of age. This might include optimising the websites user experience, improving product discovery, and analysing browser behaviour rather than customer characteristics.
4. Conclusion
To conclude, our analysis revealed no significant relationship between product type preferences and gender , as evidenced by the chisquared test results. Additionally, the t-test indicated no significant difference in time spent on the website between users aged 30 and under and those above 30. To further enhance our understanding of customer behaviour, the company could consider collecting data on user preferences based on lifestyle factors like shopping habits or interests. Gather qualitative feedback through customer surveys could provide insights on product choices and website engagement.
Are you struggling to keep up with the demands of your academic journey? Don't worry, we've got your back!
Exam Question Bank is your trusted partner in achieving academic excellence for all kind of technical and non-technical subjects. Our comprehensive range of academic services is designed to cater to students at every level. Whether you're a high school student, a college undergraduate, or pursuing advanced studies, we have the expertise and resources to support you.
To connect with expert and ask your query click here Exam Question Bank
