Statistical Analysis of Hospital Stay Duration Assingment
- Country :
Australia
Question 1 One-Sample t-test
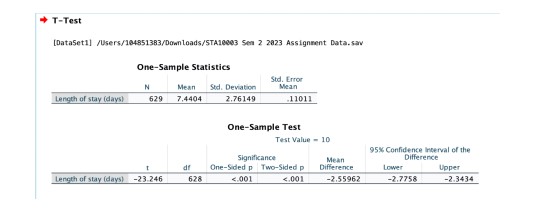
The researcher claims that the average duration of hospital stays for heart patients differs from the 2020 data, which showed an average of 10 days.
The data was collected from 629 Australian heart patients admitted to the hospital, and the average stay was found to be 7.44 days, (s = 2.76). Despite the sample average being lower than the population average, a two-tailed test was conducted. The test statistic, t(628) = -23.25, p-value < 0>
Question 2 Independent sample t-test
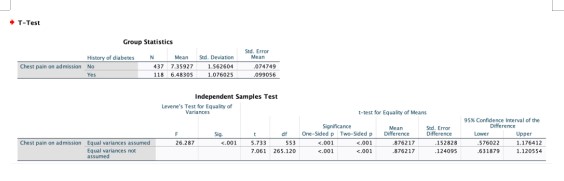
The researcher's objective was to assess whether the level of chest pain reported by Australians upon admission to a hospital with suspected myocardial infarction differs between patients with and without a history of diabetes. They employed a one-tailed test. The test applied is two-sample independent t-test for this purpose.
Data was collected from two groups of heart patients, one without a history of diabetes, with an average reported chest pain of 7.36 (s = 1.56), and the other with a diabetes history, with an average reported chest pain of 6.48 (s = 1.08). The test statistic, t(265.12) = 7.06, p-value < 0>
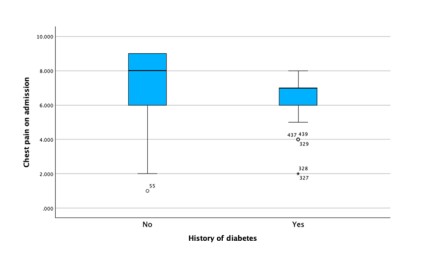
2b. Assumptions:
The main assumptions of two sample t-test are the normality and equal variance. Here both the assumptions are check using the boxplot.
The box plots revealed non-normality in the sampling distribution, showing a skewed distribution for both groups. Additionally, the box plot designed to assess variance indicated that the two groups exhibited different variances. Consequently, it is suitable to employ a two-sample independent t-test with the assumption of unequal variances in this scenario.
Question 3 Paired sample t-test
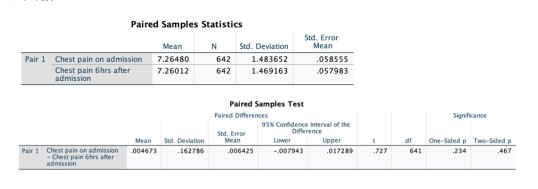
The researcher's objective was to assess whether the level of chest pain reported by Australians upon admission to a hospital with suspected myocardial infarction is higher six hours after admission compared to the initial admission. To investigate this, a paired t-test was employed because data was collected from the same patients at two different time points, and it was a one-tailed test.
Data from 642 patients revealed that the average chest pain upon admission was 7.26 (s =1.48), and the average chest pain six hours after admission was also 7.26 (s = 1.47). The paired t-test was conducted, resulting in a test statistic of t(641) = 0.73, with a p-value of 0.23.
As the p-value exceeded the significance level of 0.05, the null hypothesis was not rejected. The confidence interval of difference between two groups is -0.01 to 0.02. The confidence interval does contain 0, hence the confidence interval supports the hypothesis testing. Hence, we can say that there is no difference in the chest pain of two groups.
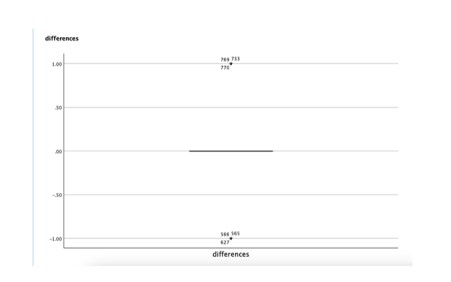
3b. The assumptions of paired t-test is normality. The boxplot constructed does not reveals that the sampling distribution of difference is approximately normal. Hence, we can assume the assumption of normality There is not need to check the equal variance assumption.
Are you struggling to keep up with the demands of your academic journey? Don't worry, we've got your back! Exam Question Bank is your trusted partner in achieving academic excellence for all kind of technical and non-technical subjects.
Our comprehensive range of academic services is designed to cater to students at every level. Whether you're a high school student, a college undergraduate, or pursuing advanced studies, we have the expertise and resources to support you.
To connect with expert and ask your query click here Exam Question Bank
